Open topic with navigation
Configuring Exchange monitor settings
If you have not done so already, launch the Protecting an Exchange Server workflow.
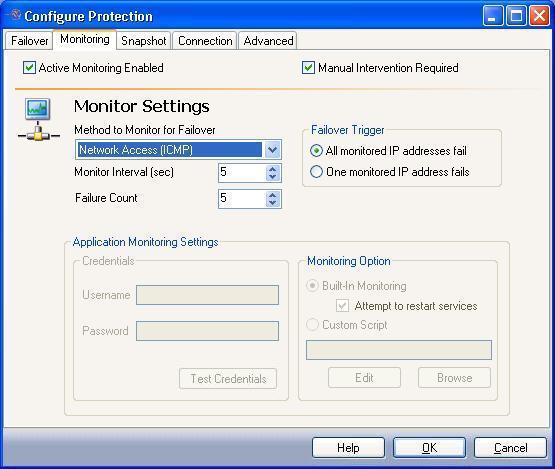
The Monitoring tab includes options for configuring how you want to monitor the source server for failure.
Configure how you want to monitor the source server for failure.
- By default, Active Monitoring Enabled is selected. Active Monitoring allows you to enable or disable failover for the selected source/target pair.
- By default, Manual Intervention Required is selected. Manual intervention allows you to control when failover occurs. When a failure occurs, a prompt appears and waits for you to initiate the failover process manually.
Disable Manual Intervention Required only if you want failover to occur immediately when a failure condition is met.
- In the Method to monitor for Failover field, select the ping method to use when monitoring source IP addresses.
- Network Access (ICMP)—Double-Take Availability failover uses ICMP pings to determine if the source server is online. If a network device, such as a firewall or router, between the source and target is blocking ICMP traffic, failover monitors cannot be created or used.
- Replication Service (UDP)—The Double-Take service on the target server sends a ping-like UDP request to the source Double-Take service, which replies immediately to confirm it is running. This method is useful when ICMP is blocked on routers between the source and target.
- Application Monitoring—If you select the Application Monitoring option, the fields in Application Monitoring Settings area will be enabled.
|
Note:
|
In order to use Application Monitoring, the monitored servers must be running Double-Take Availability version 5.2 or later.
Application monitoring is not available when dealing with a cluster.
|
- Configure how long to wait after a source failure to initiate failover. The amount of time before failover begins is calculated by multiplying the Monitor Interval by the Failure Count. For example, if the Monitor Interval is set to 5 seconds and the Failure Count setting is 5, a failover condition will be identified after 25 seconds of missed source activity.
|
Note:
|
In a cluster environment, make sure to include a cushion to account for the time it takes for the EVS to failover between nodes. Setting values too low will cause the Application Manager to assume the source cluster has failed and will indicate that a failover condition has been met.
|
- In the Monitor Interval field, select how often the monitor should check the source machine availability (Default = 5 seconds, or 60 seconds if Application Monitoring is selected).
- In the Failure Count field, select how many monitor replies can be missed before assuming the source machine has failed (Default = 5 missed replies, or 3 replies if Application Monitoring is selected).
- If you are monitoring multiple IP addresses, select one of the Failover Trigger options.
- All Monitored IP Addresses Fail—Failover begins when all monitored IP addresses fail.
- One Monitored IP Address Fails—Failover begins when any of the monitored IP addresses fail.
- If you selected Application Monitoring as the Method to Monitor for Failover, enter information in the Application Monitoring Settings area.
- In the Username field, enter the fully-qualified user name that will be used to run WMI scripts. The fully-qualified user name must be in the format domain\username or username@domain.
|
Note:
|
The required credentials for running WMI scripts is full WMI access to the CIMV2 namespace. Under Windows 2008, the supplied credentials must also be allowed through DCOM and User Access Control. It is recommended that a group be created for running scripts, and that the required permissions be given to the group.
By default, the administrative group of a Windows 2008 machine has full WMI access. However, DCOM and User Access Control settings may need to be adjusted.
For more information, see Application Manager Credentials.
|
- In the Password field, enter the password for the specified user account.
- Click the Test Credentials button to validate that the specified credentials are sufficient to run WMI scripts.
- In the Monitoring Option area, select one of the following options.
- Built-in Monitoring—Use the default application monitoring options.
If desired, you can select the Attempt to restart services checkbox to automatically attempt to restart the monitored application services.
- Custom Monitoring Script—Launch a PS1 (PowerShell), VB (VisualBasic), or Jscript file to check application health. Either type the name of the script, or click Browse to locate a script. After a script is selected, you can click Edit to launch a text editor to view or modify the script.
|
Note:
|
- An example script that you can use as a basis for creating your custom script is included in the \Samples subfolder where the Application Manager is installed.
- To use PS1 scripts, PowerShell must be installed on the target.
|
Next step: Configure snapshot settings
