1. Establishing a connection
- Open the Replication Console.
- Click Make a connection from the right pane of the Replication Console. If that quick launch screen is no longer visible, select Tools, Connection Wizard.
| Note: |
If the Double-Take Servers root is highlighted in the left pane of the Replication Console, the Connection Wizard menu option will not be available. To access the menu, expand the server tree in the left pane, and highlight a server in the tree. |
- The Connection Wizard opens to the Welcome screen. Review this screen and click Next to continue.
| Note: |
At any time while using the Connection Wizard, click Back to return to previous screens and review your selections. |
- If you highlighted a source in the Replication Console, the source will already be selected. If it is not, select the Double-Take Availability source. This is the server that you want to protect. Click Next to continue.
| Note: |
Double-Take Availability will automatically attempt to log on to the selected source using the identification of the user logged on to the local machine. If the logon is not successful, the Logon dialog box will appear prompting for your security identification. When logging in, the user name, password, and domain are limited to 100 characters. |
- If you highlighted a target in the Replication Console, the target will already be selected. If it is not, select the Double-Take Availability target. This is your backup server that will protect the source. Click Next to continue.
| Note: |
Double-Take Availability will automatically attempt to log on to the selected target using the identification of the user logged on to the local machine. If the logon is not successful, the Logon dialog box will appear prompting for your security identification. When logging in, the user name, password, and domain are limited to 100 characters. |
- On the next screen, verify Create a new replication set with this name is selected.
- Enter a name for your replication set, and click Next to continue.
- A tree display appears identifying the volumes and directories available on your source. Mark the check box of the volumes and/or directories you want to protect. Click Next to continue.
- There are two pre-defined locations to store the source data on the target, or you can select a custom location. For this evaluation, select the option Send all data to the same path on the target. This option keeps the directory structure on the source and target identical.
- Click Next to continue.
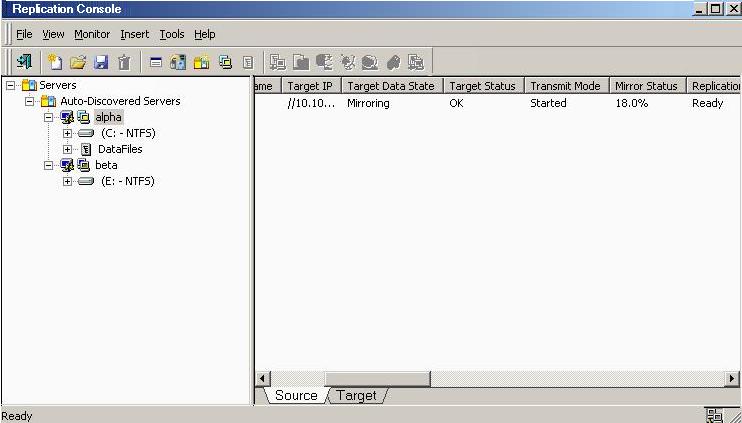
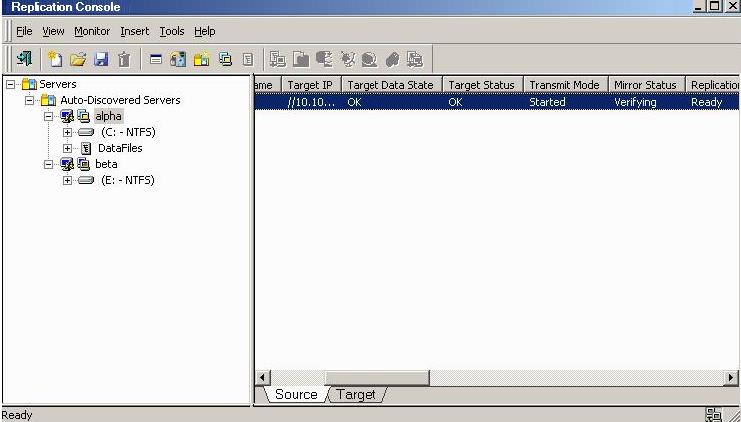
- Review your selections on the summary screen. You do not need to set any advanced options for this evaluation, so click Finish. The Connection Wizard will close, the connection will be established, and mirroring and replication will begin.
- You will be prompted to save your newly created replication set. Click Yes to save it.