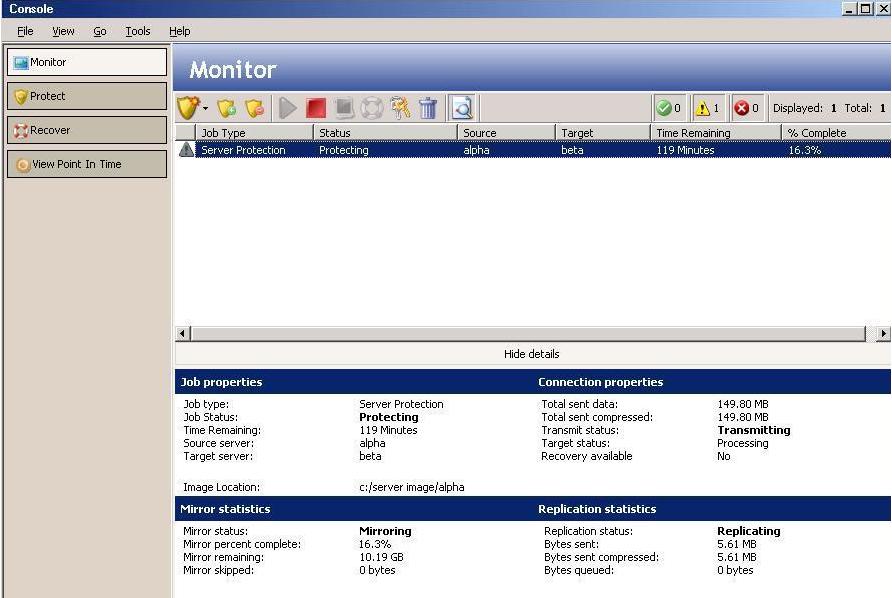
Once you have a job established or imported, you can easily monitor the status of the job from the Monitor page.
When viewing the Monitor page, the main window is divided into two sections. The top pane displays overview monitoring information, while the bottom pane displays detailed data. You can hide the details pane by clicking on the Hide details text. You can display the details pane by clicking on the Show details text.
There is also a toolbar on the Monitor page for specific job and monitoring controls.
Overview information is provided for each job at the top of the Monitor page.
| Column | Description |
|---|---|
| <no label> |
The first unlabeled column is an icon that indicates at-a-glance the status of the job.
|
| Job Type |
|
| Status | There are many different status messages that keep you informed of the progress of your jobs. Most of the status messages are informational and do not require any administrator interaction. If you see error messages, check the job details. You can also view the Double-Take log file on the server for additional information about processing on that machine. |
| Source |
Source indicates which server is transmitting mirror and replication data.
|
| Target |
Target indicates which server is receiving mirror and replication data.
|
| Time Remaining | When mirroring, this is the estimated time remaining to complete the mirror. For various reasons, this calculation is an estimate. For example, some file components, like alternate data streams, cannot be included in mirror calculations, or the size of the data set may have changed after the mirror started. |
| % Complete | When mirroring, this is the estimated percentage of the mirror that is complete. For various reasons, this calculation is an estimate. For example, some file components, like alternate data streams, cannot be included in mirror calculations, or the size of the data set may have changed after the mirror started. |
Detailed information is provided for each job at the bottom of the Monitor page.
| Section | Detailed Item | Description |
|---|---|---|
| Job properties | Job type |
|
| Job Status |
There are many different status messages that keep you informed of the progress of your jobs. Most of the status messages are informational and do not require any administrator interaction. If you see error messages, check the job details. If the Job Status is Communication Error, the issue could be several things such as the source server is unavailable or the client has invalid credentials for the source. If it is a problem with the source server, perhaps the Double-Take service is not running, resolve the problem on the source. If the source appears to have no issues, try refreshing the job credentials through the Update credentials toolbar button. For more details on error messages, review the log file on the server for additional information about processing on that machine. |
|
| Time Remaining | When mirroring, this is the estimated time remaining to complete the mirror. For various reasons, this calculation is an estimate. For example, some file components, like alternate data streams, cannot be included in mirror calculations, or the size of the data set may have changed after the mirror started. | |
| Source server |
Source server indicates which server is transmitting mirror and replication data.
|
|
| Target server |
Target server indicates which server is receiving mirror and replication data.
|
|
| Image Location | This is the location on the Target server where the data or image is stored. | |
| Connection Properties | Total sent data | This is the total amount of data (mirroring and replication) that has been sent from the Source server to the Target server. |
| Total sent compressed | This is the total amount of compressed data (mirroring and replication) that has been sent fromthe Source server to the Target server. If compression is disabled, this statistic will be the same as Total sent data. | |
| Transmit status |
|
|
| Target status |
|
|
| Recovery available |
|
|
| Mirror statistics | Mirror status |
|
| Mirror percent complete | This is the estimated percentage of the mirror that is complete. For various reasons, this calculation is an estimate. For example, some file components, like alternate data streams, cannot be included in mirror calculations, or the size of the data set may have changed after the mirror started. | |
| Mirror remaining | This is the estimated amount of mirroring data that still has to be transmitted. For various reasons, this calculation is an estimate. For example, some file components, like alternate data streams, cannot be included in mirror calculations, or the size of the data set may have changed after the mirror started. | |
| Mirror skipped | This is the amount of mirroring data that has been skipped (because the data is not different on the Source server and Target server). | |
| Replication statistics | Replication status |
|
| Bytes sent | This is the total amount of replication data that has been sent from the Source server to the Target server. | |
| Bytes sent compressed | This is the total amount of compressed replication data that has been sent from the Source server to the Target server. If compression is disabled, this statistic will be the same as Bytes sent. | |
| Bytes queued | This is the total amount of replication data that is in queue on the source. |
The Monitor page has its own toolbar buttons for job and monitoring controls.
| Toolbar Icon | Tooltip Text | Description |
|---|---|---|
|
|
New activity | The large shield icon on the far left of the toolbar opens a small menu that lets you select an action to perform. Select Protect or Recover. |
|
|
Import jobs | The smaller shield icon with the green circle with white plus sign allows you to launch the import jobs workflow. |
|
|
Stop monitoring job | The smaller shield icon with the red circle with white line removes the job from the console Monitor page. The job remains active, but is no longer visible from the console. To see the job again, import it using the Import jobs button. If you want to permanently delete the job, use the Delete job button. |
|
|
Resume |
The green triangle icon resumes the selected job. |
|
|
Stop | The red square icon stops the selected job. The image of the source, at the time the job was stopped, is still available for recovery, but the image is no longer being updated with data changes from the source. If you want to use the job again, you must restart it using the Resume button. When you restart a job, a remirror will automatically be performed. |
|
|
Take a snapshot | The blue icon resembling a photograph takes an immediate snapshot of the data on the repository server. A pop-up dialog box will notify you of the success or failure of the snapshot. |
|
|
Recover | The life preserver icon starts the recovery process for the selected job. |
|
|
Update credentials |
The keys icon allows you to specify credentials for the Source server and the Target server. If the Password associated with a specified User name changes after a job has been started, Double-Take Backup will attempt to update the credentials it is using. If the automatic update is not successful, the monitor page will report Invalid credentials. In this case, you will need to manually update the credentials that the job is using the Update credentials button. |
|
|
Delete job | The trash can icon permanently deletes the selected job. The image of the source, at the time the job was deleted, is still available for recovery, but the image is no longer being updated with data changes from the source. If you want to use the job again, you must re-create it using the New activity button. |
|
|
View details | The paper with magnify glass icon toggles between displaying and hiding the details at the bottom of the Monitor page. |
|
|
OK | The green circle with the white checkmark icon toggles between displaying and hiding those jobs that are in a good state. The number of jobs in the good state is also displayed on the toolbar button. |
|
|
Warnings | The yellow triangle with the black exclamation point icon toggles between displaying and hiding those jobs that are in a warning state. The number of jobs in the warning state is also displayed on the toolbar button. |
|
|
Error | The red circle with the white X icon toggles between displaying and hiding those jobs that are in an error state. The number of jobs in the error state is also displayed on the toolbar button. |
| To the right of all of the toolbar buttons is a summary of the number of jobs displayed by the good, warning, and error state toggle buttons. The total number of jobs available for display in this console is also displayed. |
 Overview status information
  Related Topics