| Note: |
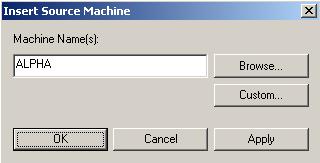
If the target you need is not listed, click Add Target and manually enter a name or IP address (with or without a port number). You can also select the Browse button to search for a target machine name. Click OK to select the target machine and return to the Failover Control Center main window. |
The Insert Source Machine dialog closes and the Monitor Settings dialog remains open with your source listed in the Names to Monitor tree.
| Note: |
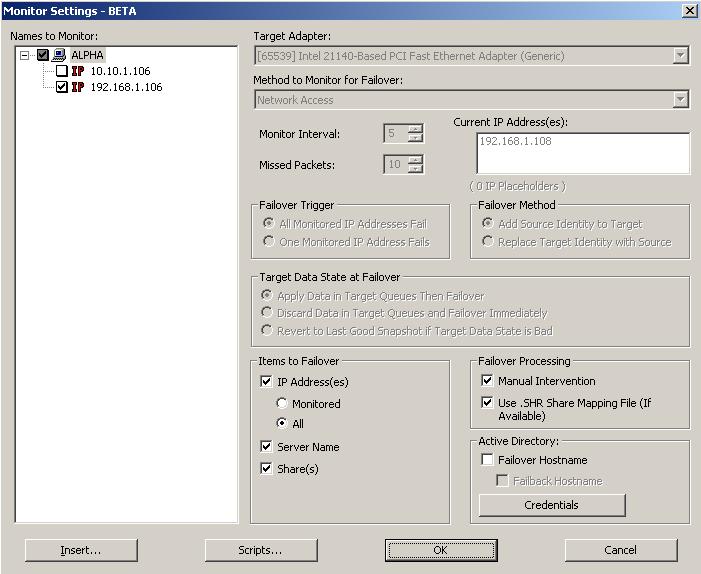
To achieve shorter delays before failover, use lower Monitor Interval and Missed Packets values. This may be necessary for IP addresses on machines, such as a web server or order processing database, which must remain available and responsive at all times. Lower values should be used where redundant interfaces and high-speed, reliable network links are available to prevent the false detection of failure. If the hardware does not support reliable communications, lower values can lead to premature failover. To achieve longer delays before failover, choose higher values. This may be necessary for IP addresses on slower networks or on a server that is not transaction critical. For example, failover would not be necessary in the case of a server restart. |
| Note: |
If you are monitoring multiple IP addresses, IP address conflicts may occur during failover when the number of IP addresses that trigger failover is less than the number of IP addresses that are assumed by the target during failover. For example, if a source has four IP addresses (three public and one private), and two of the three public addresses are monitored, but all three public addresses are configured to failover, a conflict could occur. If the source fails, there is no conflict because all of the IP addresses have failed and no longer exist. But if the failure only occurs on one of the monitored addresses, the other two IP addresses are still affected. If all of the addresses are failed over, these addresses then exist on both the source and the target. Therefore, when a source machine has fewer IP addresses that trigger failover than IP addresses that will be failed over, there is a risk of an IP address conflict. If your network environment is a WAN configuration, do not failover your IP addresses unless you have a VPN infrastructure so that the source and target can be on the same subnet, in which case IP address failover will work the same as a LAN configuration. If you do not have a VPN, you can automatically reconfigure the routers via a failover script (by moving the source's subnet from the source's physical network to the target's physical network). There are a number of issues to consider when designing a solution that requires router configuration to achieve IP address failover. Since the route to the source's subnet will be changed at failover, the source server must be the only system on that subnet, which in turn requires all server communications to pass through a router. Additionally, it may take several minutes or even hours for routing tables on other routers throughout the network to converge. |
| Note: |
Automatic share failover only occurs for standard Windows file system shares. Other shares must be configured for failover through the failover scripts or created manually on the target. See Macintosh shares or NFS Shares for more information. If you are failing over Windows shares but your source and target do not have the same drive letters, you must use the All to One selection when establishing your Double-Take Availability connection. Otherwise, the shares will not be created on the target during failover. If a Windows share is created on Windows 2003 with the default full access permissions (without an ACL) and then failed over, the permissions given to the target will be read-only permissions. Windows share information is automatically updated on the target once an hour. If you need to manually update the share information, click Update Shares on the main Failover Control Center window after the monitor has been established. |
| Note: |
If the Shares selection under Items to Failover is not selected, shares will not be failed over to the target regardless of the Use .SHR Share Mapping File selection. |
| Note: |
The Active Directory account password cannot be blank. |
| Note: |
Failover scripts will run but will not be displayed on the screen if the Double-Take service is not set to interact with the desktop. Enable this option through the Services applet. With these flexible scripting features, application failover using Double-Take Availability can be seamless to the end user. Double-Take Software tests many of the popular applications on the market today. The results of these testing procedures are written up into formal Application Notes that describe how Double-Take Availability should be configured to work correctly with certain applications, including scripting examples. For a complete list of Double-Take Availability Application Notes, visit the Double-Take Software support web site. |
 Related Topics