Double-Take Availability User's Guide Printable Version
This document is a single HTML page that contains all of the separate HTML pages in the Double-Take Availability User's Guide. This single HTML document is designed to make printing the entire User's Guide easier. You can also print sections of the User's Guide by using your browser's print preview feature and printing only the desired pages. Keep in mind that the page numbers as seen in the Table of Contents may not match the page numbers when you print the document because of differences in printer configurations.
This printable document is not a standalone document. It requires the style definition files and graphic files used in the separate-page User’s Guide. Therefore, if you try to view or print this document on its own (for example, by copying or downloading the single file to a different location), the output will not have any formatting or graphics included.
Table of Contents
| Welcome to the Double-Take Availability User's Guide | |
| Getting started | |
| Frequently used pages | |
| Printable version | |
| Resources | |
| Legal | |
| Double-Take Availability overview | |
| Core operations | |
| Double-Take Availability workloads | |
| Full-server workloads | |
| Application workloads | |
| Virtual workloads | |
| Cluster workloads | |
| Supported configurations | |
| Double-Take Availability requirements | |
| General source and target server requirements | |
| Full-server workload requirements | |
| Application workload requirements | |
| Exchange protection requirements | |
| SQL protection requirements | |
| SharePoint protection requirements | |
| BlackBerry protection requirements | |
| File Server protection requirements | |
| Virtual workload requirements | |
| Physical or virtual to Hyper-V requirements | |
| Physical or virtual to ESX requirements | |
| Hyper-V to Hyper-V requirements | |
| ESX to ESX requirements | |
| Cluster workload requirements | |
| Double-Take Console requirements | |
| Installation | |
| Installation and upgrade notes | |
| Installing or upgrading Double-Take Availability | |
| Installing or upgrading Double-Take for VMware Infrastructure | |
| Installing Double-Take Availability automatically | |
| Configuring your cluster for GeoCluster installation | |
| Double-Take Console | |
| Starting the console | |
| Getting started | |
| Inserting servers manually | |
| Inserting servers through Active Directory discovery | |
| Inserting servers from a server configuration file | |
| Managing servers | |
| Viewing server details | |
| Viewing server events | |
| Providing server credentials | |
| Managing VirtualCenter servers | |
| Console options | |
| Setting the frequency of console refreshes | |
| Setting the console communications port | |
| Updating the console software | |
| Other consoles | |
| Replication Console | |
| Logging on and off | |
| Managing the Replication Console tree | |
| Groups | |
| Servers | |
| Sharing group and server configuration | |
| Workspaces | |
| Clearing maintained security credentials | |
| Failover Control Center | |
| Configuring communication ports | |
| Configuring the console refresh rate | |
| Clearing maintained security credentials | |
| Full-Server Failover Manager | |
| Configuring the console refresh rate | |
| Configuring the level of detail to log | |
| Clearing maintained security credentials | |
| Configuring the monitoring method for server availability | |
| Saving and reusing configuration options | |
| Application Manager | |
| Adding or managing servers | |
| Changing Application Manager options | |
| Double-Take Availability for VMware Infrastructure console | |
| Managing activation codes | |
| Managing VirtualCenter servers | |
| Managing ESX servers | |
| Setting up an e-mail server | |
| Workload protection | |
| Data protection | |
| Establishing a connection using the automated Connection Wizard | |
| Creating a replication set | |
| Establishing a connection manually using the Connection Manager | |
| Establishing a connection across a NAT or firewall | |
| Simulating a connection | |
| Data workload failover | |
| Configuring failover monitoring | |
| Updating shares on the target | |
| Editing failover monitoring configuration | |
| Removing failover monitoring configuration | |
| Server settings | |
| Identifying a server | |
| Licensing a server | |
| Configuring server startup options | |
| Configuring network communication properties for a server | |
| Queuing data | |
| Configuring source data processing options | |
| Configuring target data processing options | |
| Specifying the Double-Take Availability database storage files | |
| Specifying file names for logging and statistics | |
| Supplying credentials for script processing | |
| E-mailing event messages | |
| Full-server protection | |
| Finding a compatible target | |
| Establishing full-server protection | |
| Optional full-server protection settings | |
| Including and excluding data to be protected | |
| Stopping services on the target when protection is enabled | |
| Taking snapshots of the target | |
| Configuring failover monitoring and processing | |
| Mapping network configuration on the target for post-failover | |
| Routing data transmissions | |
| Mirroring data | |
| Compressing data | |
| Using NAT or firewalls with full-server workloads | |
| Full-server ports | |
| Microsoft Windows ports | |
| Hardware ports | |
| Application protection | |
| Protecting an application | |
| Optional application protection settings | |
| Configuring failover processing | |
| Configuring DNS failover | |
| Configuring identity failover | |
| Configuring failover monitoring | |
| Taking snapshots of the target | |
| Application connection settings | |
| Routing data transmissions | |
| Protection configuration | |
| Configuring Exchange storage group protection | |
| Configuring SQL database protection | |
| Configuring file server protection | |
| Configuring BlackBerry database protection | |
| Configuring SharePoint database protection | |
| Mirroring data | |
| Application advanced settings | |
| Configuring the replication set | |
| Configuring scripts | |
| Configuring Active Directory | |
| Configuring items to failover | |
| Configuring default connection parameters | |
| Using NAT or firewalls with application workloads | |
| Application workload ports | |
| Microsoft Windows ports | |
| Hardware ports | |
| Exchange Failover Utility | |
| Virtual server protection | |
| Protecting a physical or virtual server to a Hyper-V or ESX server | |
| Protecting a Hyper-V server to a Hyper-V server | |
| Protecting an ESX server to an ESX server | |
| Configuring ports | |
| Configuring root or non-root login | |
| Establishing ESX to ESX protection | |
| Optional ESX protection settings | |
| Scheduling protection | |
| Changing the name of the protection job | |
| Setting transmission options | |
| E-mailing notifications | |
| Updating VirtualCenter credentials | |
| Configuring restart and threshold options | |
| Using firewalls with virtual workloads | |
| Double-Take Availability ports | |
| Microsoft Windows ports | |
| Hardware ports | |
| Cluster protection | |
| Protecting a standard cluster | |
| Protecting a GeoCluster | |
| GeoCluster resource properties | |
| Configuring failover monitoring | |
| Special configurations | |
| Domain controllers | |
| NetBIOS | |
| WINS | |
| DNS | |
| Non-Microsoft DNS | |
| Macintosh shares | |
| NFS Shares | |
| Workload monitoring | |
| Data workloads | |
| Monitoring a data workload | |
| Monitoring failover monitoring | |
| Monitoring a full-server workload | |
| Monitoring an application workload | |
| Monitoring virtual workloads | |
| Monitoring virtual workloads in the Double-Take Console | |
| Viewing connection details | |
| Monitoring virtual workloads in the Double-Take Availability for VMware Infrastructure console | |
| Monitoring a cluster workload | |
| Log files | |
| Viewing the log file | |
| Filtering the log file | |
| Configuring the properties of the log file | |
| Double-Take Availability log messages | |
| Monitoring event messages | |
| Event messages | |
| E-mailing event messages | |
| Statistics | |
| Configuring the properties of the statistics file | |
| Viewing the statistics file | |
| Statistics | |
| Performance Monitor | |
| Monitoring Performance Monitor statistics | |
| Performance Monitor statistics | |
| SNMP | |
| Configuring SNMP on your server | |
| SNMP traps | |
| SNMP statistics | |
| Error codes | |
| Failover | |
| Failing over data workloads, application workloads configured for identity failover, and cluster workloads | |
| Full-server workload failover | |
| Failing over using the Full-Server Failover Manager | |
| Failing over from the command line | |
| Failing over application workloads configured for DNS failover | |
| Virtual workload failover | |
| Failing over virtual workloads in the Double-Take Console | |
| Failing over virtual workloads in the Double-Take Availability for VMware Infrastructure console | |
| Failback and restore | |
| Data workload failback and restoration | |
| Restoring then failing back | |
| Failing back then restoring | |
| Failing back and restoring a full-server workload | |
| Application failback and restoration | |
| Failback and restoration for applications configured for identity failover | |
| Restoring then failing back applications configured for DNS failover | |
| Restoring then failing back virtual workloads | |
| Connections | |
| Data queues | |
| Queuing data | |
| Auto-disconnect and auto-reconnect | |
| Reconnecting automatically | |
| Pausing and resuming target processing | |
| Blocking writing to the target paths | |
| Disconnecting a connection | |
| Mirroring | |
| Stopping, starting, pausing, or resuming mirroring | |
| Mirroring automatically | |
| Running scripts during mirroring | |
| Removing orphan files | |
| Replication | |
| Replication capabilities | |
| Replication sets | |
| Creating a replication set | |
| Creating or modifying replication rules manually | |
| Modifying a replication set | |
| Renaming and copying a replication set | |
| Calculating replication set size | |
| Deleting a replication set | |
| Starting replication | |
| Inserting tasks during replication | |
| Verification | |
| Verifying manually | |
| Verifying on a schedule | |
| Configuring the verification log | |
| Verify applications on the target | |
| Verifying applications on the target from the command line | |
| Data transmission | |
| Stopping, starting, pausing, and resuming transmission | |
| Scheduling data transmission | |
| Limiting transmission bandwidth | |
| Compressing data for transmission | |
| Snapshots | |
| Snapshots for data workloads | |
| Snapshot states | |
| Automatic snapshots | |
| Scheduling snapshots | |
| Taking snapshots manually | |
| Managing full-server and application snapshots | |
| Security | |
| Security credentials | |
| Adding users to the security groups | |
| Changing the account used to run the Double-Take service | |
| Configuring the Double-Take service for Active Directory | |
| Evaluations | |
| Evaluating data protection | |
| Evaluating full-server protection | |
This online documentation is designed to help you find detailed information about Double-Take Availability. Use the Table of Contents pane on the left to explore the different sections or use Search or Index to find specific topics. Below are some of the most useful and most accessed topics in the online documentation.
A printable version, which is a single HTML page containing all of the separate HTML pages in the Double-Take Availability User’s Guide, is available. This single HTML document is designed to make printing the entire User’s Guide easier.
Double-Take, Balance, Double-Take Availability, Double-Take Backup, Double-Take Cargo, Double-Take Flex, Double-Take for Hyper-V, Double-Take for Linux, Double-Take Move, Double-Take ShadowCaster, Double-Take for Virtual Systems, GeoCluster, Livewire, netBoot/i, NSI, sanFly, TimeData, TimeSpring, winBoot/i and associated logos are registered trademarks or trademarks of Double-Take Software, Inc. and/or its affiliates and subsidiaries in the United States and/or other countries. Microsoft, Hyper-V, Windows, and the Windows logo are trademarks or registered trademarks of Microsoft Corporation in the United States and/or other countries. All other trademarks are the property of their respective companies.
© 1996-2010 Double-Take Software, Inc. All rights reserved.
Double-Take Availability ensures the availability of critical workloads. Using real-time replication and failover, you can protect data, individual applications, entire servers, or virtual machines.
Identify your critical workload on your production server, known as the source, and replicate the workload to a backup server, known as the target. The target server, on a local network or at a remote site, stores the copy of the workload from the source. Double-Take Availability monitors any changes to the source workload and sends the changes to the copy stored on the target server. By replicating only the file changes rather than copying an entire file, Double-Take Availability allows you to more efficiently use resources.
Double-Take Availability performs four basic types of operations.
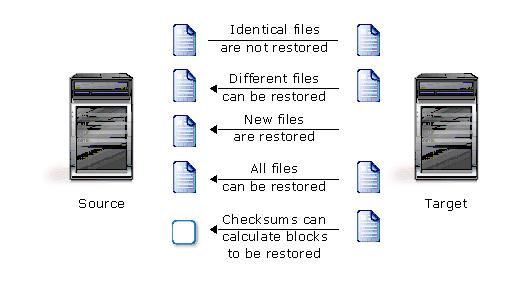
Mirroring is the process of transmitting user-specified data from the source to the target so that an identical copy of data exists on the target. When Double-Take Availability initially performs mirroring, it copies all of the selected data, including file attributes and permissions. Mirroring creates a foundation upon which Double-Take Availability can efficiently update the target server by replicating only file changes.
If subsequent mirroring operations are necessary, Double-Take Availability can mirror specific files or blocks of changed data within files. By mirroring only files that have changed, network administrators can expedite the mirroring of data on the source and target servers.
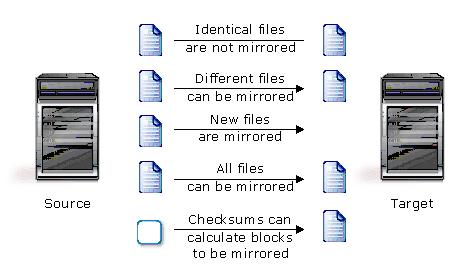
Mirroring has a defined end point - when all of the selected files from the source have been transmitted to the target. When a mirror is complete, the target contains a copy of the source files at that point in time.
Replication is the real-time transmission of file changes. Unlike other related technologies, which are based on a disk driver or a specific application, the Double-Take Availability replication process operates at the file system level and is able to track file changes independently from the file’s related application. In terms of network resources and time, replicating changes is a more efficient method of maintaining a real-time copy of data than copying an entire file that has changed.
After a source and target have been connected through Double-Take Availability, file system changes from the user-defined data set are tracked. Double-Take Availability immediately transmits these file changes to the target server. This real-time replication keeps the data on the target up-to-date with the source and provides high availability and disaster recovery with minimal data loss.
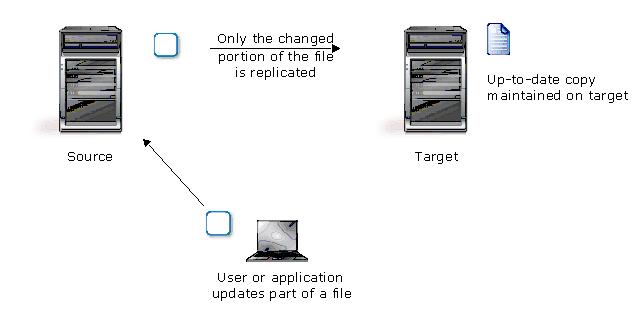
Unlike mirroring which is complete when all of the files have been transmitted to the target, replication continuously captures the changes as they are written to the source. Replication keeps the target up-to-date and synchronized with the source.
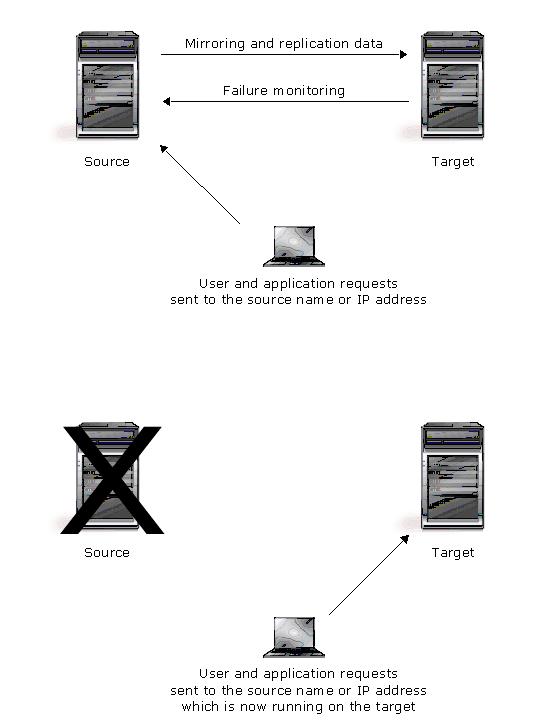
Failover is the process in which a target stands in for a failed source. As a result, user and application requests that are directed to the failed source are routed to the target.
Double-Take Availability monitors the source status by tracking network requests and responses exchanged between the source and target. When a monitored source misses a user-defined number of requests, Double-Take Availability assumes that the server has failed. Double-Take Availability then prompts the network administrator to initiate failover, or, if configured, it occurs automatically.
The failover target assumes the network identity of the failed source. When the target assumes the identity of the source, user and application requests destined for the source server or its IP address(es) are routed to the target.
When partnered with the Double-Take Availability data replication capabilities, failover routes user and application requests with minimal disruption and little or no data loss. In some cases, failover may be used without data replication to ensure high availability on a server that only provides processing services, such as a web server.
Restoration provides an easy method for copying replicated data from the target back to its original location on the source. The process only requires you to select the source, target, and the appropriate replication set. There is no need to select files or to remember where the data came from on the source since that information is maintained by Double-Take Availability.
Restoration can be used if the source data is lost due to a disk crash or when the most up-to-date data exists on the target due to failover. At the time of a source server failure, your Double-Take Availability target will contain the same data as your Double-Take Availability source. If you are using the Double-Take Availability failover capabilities, users can continue updating data on the target server while the problems on the source are resolved. Because of the continued updates on the target, when the source server is ready to come back online, the two servers will no longer contain the same data. Restoration is the process of copying the up-to-date data from the target back to the original source or a new source.
When a restoration is complete, the source and target are again synchronized. Replication continues from the target to the source, keeping the two servers synchronized, until you disconnect the restoration connection.
Building on Double-Take Availability core operations, you can protect specific workloads to meet your protection goals.
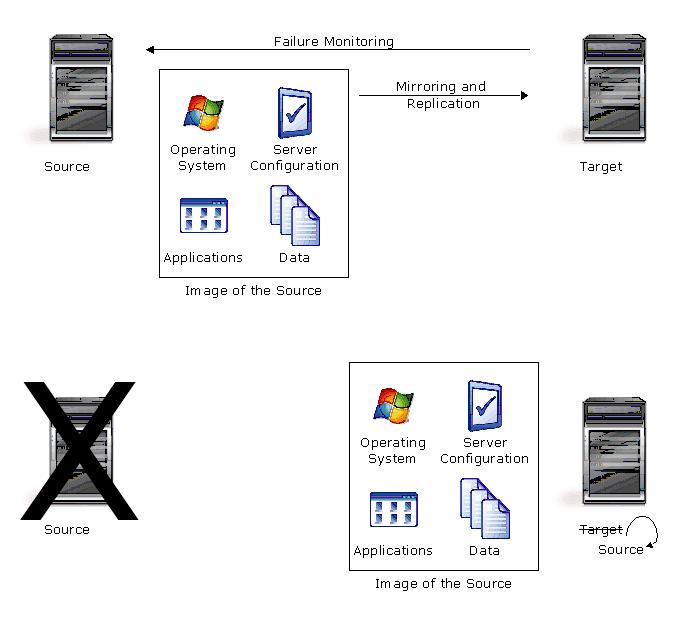
Full-server workload protection provides high availability for an entire server, including the system state, which is the server's configured operating system and applications. You identify your source, which is the server you want to protect, and your target, which is the server that will stand-in for the source in the event the source fails. Once the two servers are selected and their configurations validated, Double-Take Availability monitors the source for a failure. When it fails, Double-Take Availability allows the target to stand-in for the source by rebooting and applying the source, including its system state, on the target. After the reboot, the target becomes the source, and the target no longer exists.
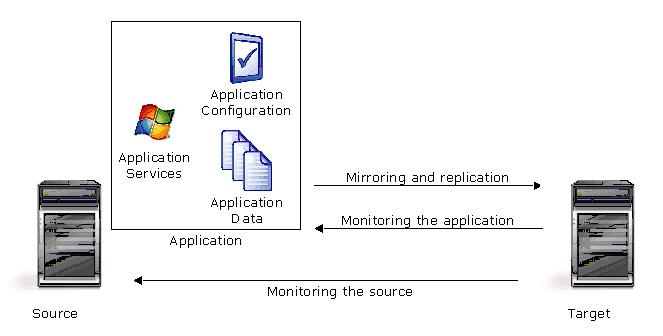
Application workload protection provides high availability for Exchange, SQL, SharePoint, BlackBerry, and a Windows file server. You identify your source, which is the server running the application, and your target, which is the server that will stand-in for the source in the event the source fails. Double-Take Availability will gather information from your environment (Active Directory, DNS, and so on) about the application being protected and automatically protect the application. Double-Take Availability monitors the source server or the application services for a failure. When it fails, Double-Take Availability allows the target to stand-in for the source. Your end-users can continue to access the application running on the target, which is standing in for the source.
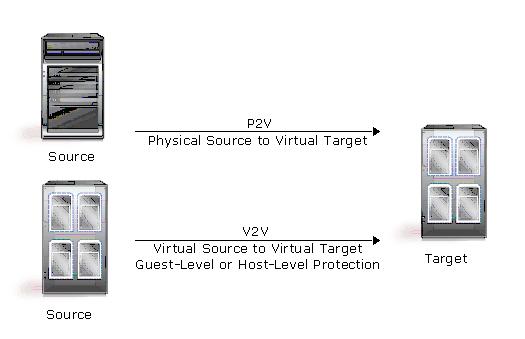
Virtual workload protection provides high availability to Hyper-V or ESX virtual servers. You identify your source, which is the server you want to protect. Your source can be a physical server, a virtual machine where you want to protect the data within the guest operating system, or a virtual machine where you want to protect the host-level virtual disk files (.vhd or .vmdk files). Your target is a Hyper-V or ESX server that will host a virtual machine that is a replica of the source. Double-Take Availability monitors the source for a failure. In the event of a source failure, the replica virtual machine on the target can stand-in allowing end-users to continue accessing data and/or applications.
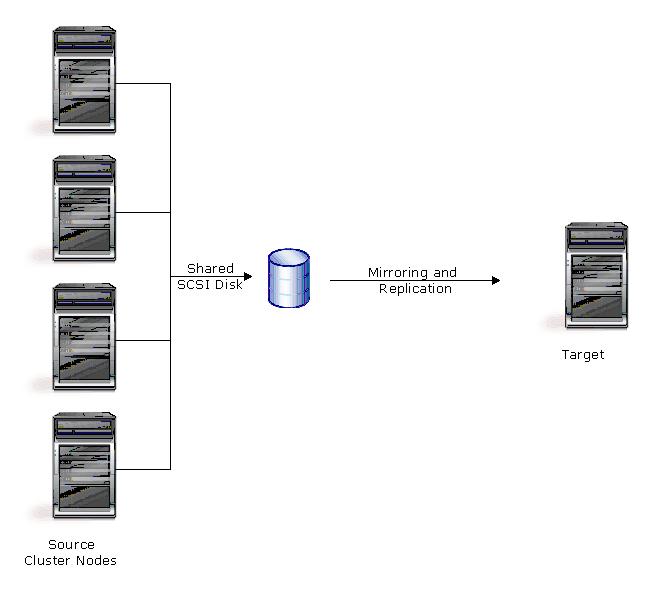
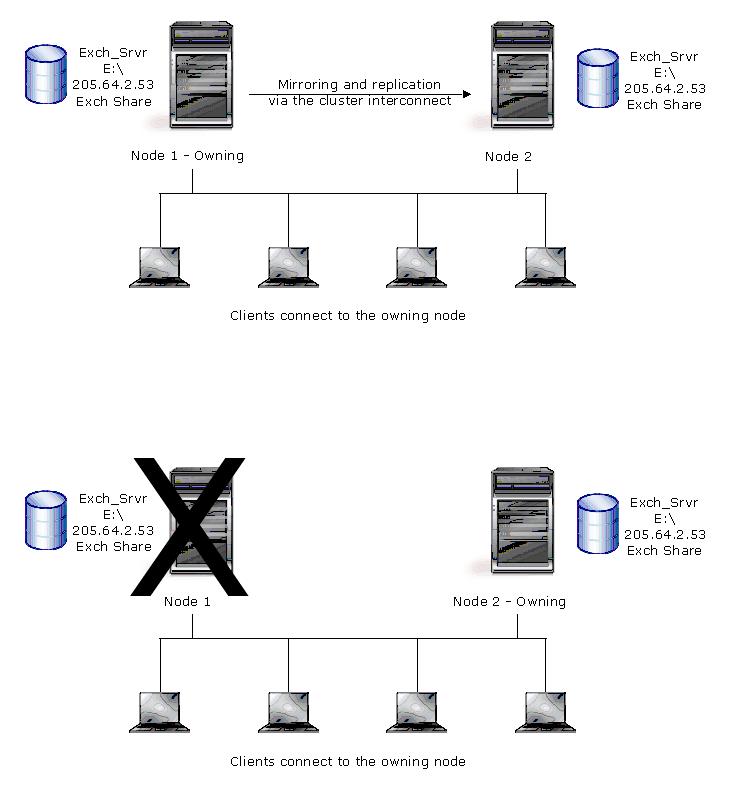
In a standard cluster configuration, a single copy of data resides on a SCSI disk that is shared between cluster nodes. Data is available without users knowing which node owns a cluster resource. MSCS handles failover between nodes of the cluster. By adding Double-Take Availability to this cluster environment, you can further protect your data by replicating the cluster data to a target. In the event the cluster fails, your cluster data will be available on the target.
In a GeoCluster configuration, data is stored on volumes local to each node and replicated to each node in the cluster using Double-Take Availability. Resources and groups are handled in the same manner as a standard cluster. Instead of assigning one group by SCSI drive, you assign one group per logical volume. If a server, disk, group, or network interface should fail, MSCS relocates the failed group to another node, which contains the replicated copy of the data, thus maintaining availability.
Double-Take Availability is an exceptionally flexible product that can be used in a wide variety of network configurations. To implement Double-Take Availability effectively, it is important to understand the possible configuration options and their relative benefits. Double-Take Availability configuration options can be used independently or in varying combinations.
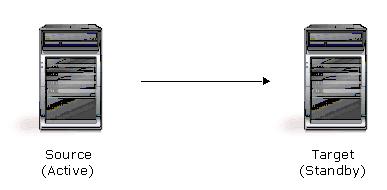
| Description | One target server, having no production activity, is dedicated to support one source server. The source is the only server actively replicating data. |
| Applications |
|
| Considerations |
|
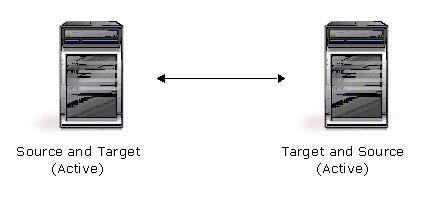
| Description | Each server acts as both a source and target actively replicating data to each other |
| Applications | This configuration is appropriate for failover and critical data backup. This configuration is more cost-effective than the Active/Standby configuration because there is no need to buy a dedicated target server for each source. In this case, both servers can do full-time production work. |
| Considerations |
|
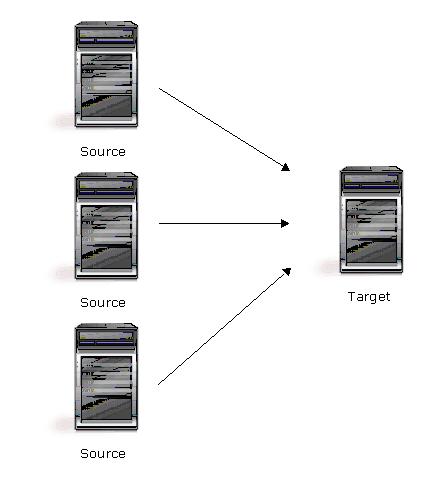
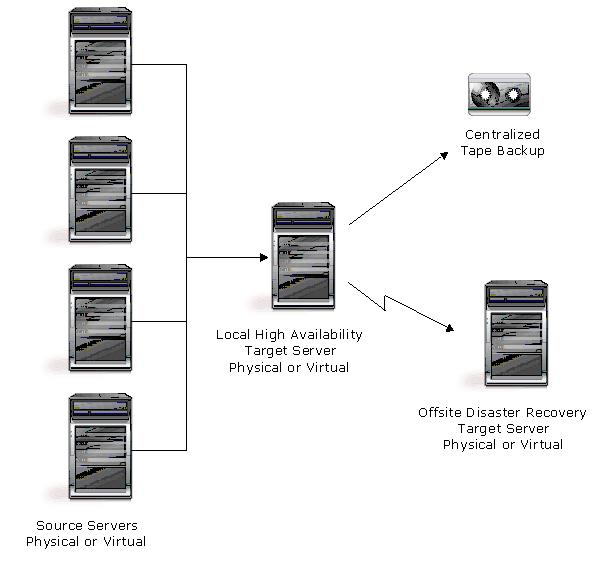
| Description | Many source servers are protected by one target server. |
| Applications | This configuration is appropriate for offsite disaster recovery. This is also an excellent choice for providing centralized tape backup because it spreads the cost of one target server among many source servers. |
| Considerations |
|
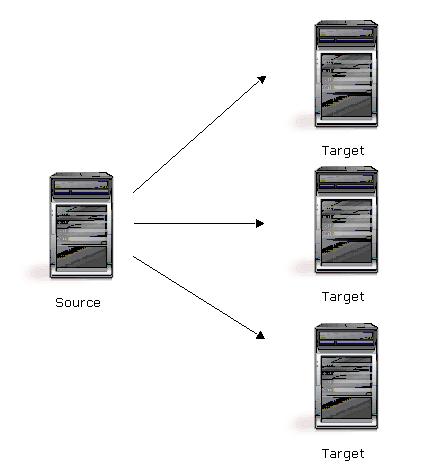
| Description | One source server sends data to multiple target servers. The target servers may or may not be accessible by one another. |
| Applications | This configuration provides offsite disaster recovery, redundant backups, and data distribution. For example, this configuration can replicate all data to a local target server and separately replicate a subset of the mission-critical data to an offsite disaster recovery server. |
| Considerations |
|
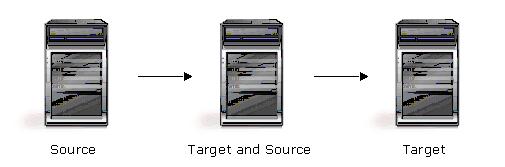
| Description | The source servers sends replicated data to a target server, which acts as a source server and sends data to a final target server, which is often offsite. |
| Applications | This is a convenient approach for integrating local high availability with offsite disaster recovery. This configuration moves the processing burden of WAN communications from the source server to the target/source server. After failover in a one-to-one, many-to-one, or one-to-many configuration, the data on the target is no longer protected. This configuration allows failover from the first source to the middle machine, with the third machine still protecting the data. |
| Considerations |
|
Each Double-Take Availability server must meet minimum requirements. If you are protecting certain workloads, your servers may need to meet additional requirements. Verify that each server meets the general requirements and any additional requirements for your workload type. Additionally, the machine where you will be running the console must also meet several requirements.
| License | Windows 2003 and 2003 R2 Operating Systems |
Windows 2008 and 2008 R2 Operating Systems |
Virtual Servers | |
|---|---|---|---|---|
|
Guest-Level Protection |
Host-Level Protection |
|||
| Foundation Edition |
|
|
N/A |
N/A |
| Standard Edition |
|
|
1 |
N/A |
| Advanced Edition |
|
|
1 |
N/A |
| Premium Edition |
|
|
Unlimited |
N/A |
| Virtual Guest 5-Pack |
Any valid Foundation, Standard, Advanced, or Premium Edition operating system | 5 | N/A | |
| Virtual Host Standard Edition | N/A |
|
N/A |
|
| Virtual Host Advanced Edition | N/A |
|
N/A |
|
| Virtual Host Premium Edition | N/A |
|
N/A |
|
| Note: |
Microsoft Server Core is supported for data workloads. See the specific requirements for the workload type you are protecting for additional Server Core requirements. |
| Operating System | Minimum System Memory | Recommended System Memory |
|---|---|---|
| Any Windows i386 operating system | 128 MB | At least 512 MB |
| Any Windows x64 operating system | 512 MB | At least 1024 MB |
| Note: | The program files can be installed to any volume while the Microsoft Windows Installer files are automatically installed to the operating system boot volume. |
If you will be protecting an entire server, the general source and target server requirements apply. However, keep in mind that a target server may meet these requirements but may not be suitable to stand-in for a source in the event of a source failure. See Finding a compatible target for additional information regarding an appropriate target server for your particular source.
| Note: |
If you are using Small Business Server, you will need to check with your NAS vendor to verify if there are technical or license restrictions on failing over an image of a server to different hardware. Microsoft Server Core is only supported in a Server Core to Server Core configuration. |
There is one limitation for full-server protection of a cluster. Microsoft clusters identify disks by their disk signature, which is stored on the physical disk in the master boot record. When Double-Take Availabilityis used to failover a cluster node, the disk signature of the target will be different than the source and the cluster will fail to start. Therefore, Double-Take Availability does not natively support the full-server protection of Microsoft cluster nodes. However, you can alter the disk signature on the target manually. See the Microsoft Knowledge Base article 280425 for details on how to change the disk signature.
If you will be protecting an application, the general source and target server requirements apply. In addition, you must meet the application requirements below.
In addition to the general application requirements, you must also meet the following requirements to protect Exchange.
| Note: |
If you are protecting Exchange in a 2008 R2 domain where the domain functional level is set to R2, you must grant two levels of access to the local system account on the target. First, grant the Administer information store control to the target in the Configuration Naming Context in order to move users during failover. Second, grant Full control to the target in the Domain Naming Context in order to move Service Principal Names, which will allow users to access their e-mail after a failover. |
In addition to the general application requirements, you must also meet the following requirements to protect SQL.
In addition to the general application requirements, you must also meet the following requirements to protect SharePoint.
In addition to the general application requirements, you must also meet the following requirements to protect BlackBerry.
In addition to the general application requirements, you must also meet the following requirements to protect a file server.
When you are protecting virtual server workloads, the general source and target server requirements still apply, however, the requirements and limitations are more strict depending on your virtual configuration. Select a link from the table below to see the requirements that correspond with your virtual configuration.
| If your source is... | and you want to protect... | and your target is... | then see these requirements... |
|---|---|---|---|
| a physical or virtual server | the volumes from the physical server or the volumes from within the virtual guest operating system | a virtual server on a Hyper- V server | Physical or virtual to Hyper-V requirements |
| a virtual server on an ESX server | Physical or virtual to ESX requirements | ||
| a virtual server on a Hyper-V server | the host-level virtual disk files (.vhd and .vmdk files) | a virtual server on a Hyper-V server | Hyper-V to Hyper-V requirements |
| a virtual server on an ESX server | a virtual server on an ESX server | ESX to ESX requirements |
Use these requirements if your source is a physical or virtual server, you want to protect the volumes from the physical server or volumes from within the virtual guest operating system, and your target is an automatically provisioned virtual server on a Hyper-V server. This means Double-Take Availability will automatically create the virtual server on the Hyper-V target if failover is triggered.
Use these requirements if your source is a physical or virtual server, you want to protect the volumes from the physical server or volumes from within the virtual guest operating system, and your target is an automatically provisioned virtual server on an ESX server. This means Double-Take Availability will automatically create the virtual server on the ESX target if failover is triggered.
| Note: |
If you are using the Standard edition of ESX 4.0 or ESXi 4.0, you must have update 1 or later. If your source is a Windows 2008 R2 server, your ESX server must have version 3.5 update 5 or later or ESX 4.0 update 1 or later. |
| Note: | VMotion is only supported if you are using VirtualCenter. |
Use these requirements if your source is a virtual server on a Hyper-V server, you want to protect the host-level virtual disk files, and your target is a virtual server on a Hyper-V server.
Use these requirements if your source is a virtual server on an ESX server, you want to protect the host-level virtual disk files, and your target is a virtual server on an ESX server.
| Note: | If your source and target are running on different versions of ESX, ideally, the target should be a newer version of ESX. If your source must be a newer version of ESX than the target, you must take into consideration ESX features that are supported on the newer version on the source (like VmxNet enhanced or additional virtual NICs available) that will not be supported on the earlier target version of ESX. |
| Note: |
VMotion is only supported if you are using VirtualCenter. Do not use MSDE for the VirtualCenter database. |
There are various Double-Take Availability consoles, many of which are being phased out over time. To help consolidate the consoles and help you locate the necessary workflows to complete your work, use the console called Double-Take Console. You must meet the following requirements for the Double-Take Console.
Before beginning the installation, review the Double-Take Availability requirements and Installation and upgrade notes. Use the installation instructions appropriate for the type of workload you are protecting
Review the following installation and upgrade notes before beginning your installation or upgrade.
| Client | Source | Target | Supported |
|---|---|---|---|
| 5.0 | 5.1 or 5.2 | 5.1 or 5.2 | No |
| 5.1 | 5.2 | 5.2 | No |
| 5.2 | 5.0 | 5.0, 5.1, or 5.2 | Yes |
| 5.2 | 5.1 | 5.0 | No |
| 5.2 | 5.1 | 5.1 or 5.2 | Yes |
| 5.2 | 5.2 | 5.0 or 5.1 | No |
| 5.2 | 5.2 | 5.2 | Yes |
Use these instructions to install Double-Take Availability or upgrade an existing Double-Take Availability installation.
Double-Take Availability uses system memory to store data in queues. Specify the maximum amount of system memory to be used for the Double-Take Availability queues and click Next to continue.
If you set the system memory queue lower, Double-Take Availability will use less system memory, but you will queue to disk sooner which may impact system performance. If you set it higher, Double-Take Availability will maximize system performance by not queuing to disk as soon, but the system may have to swap the memory to disk if the system memory is not available. In general, the amount of memory Double-Take Availability and other applications on the server are configured to use should be less than the amount of physical memory on the system to prevent low memory conditions.
In a typical Double-Take Availability installation, you install the server components on each source and target server. However, when you are protecting the host-level virtual disk files (the .vmdk files) from an ESX source to an ESX target, you need to install the server components on another machine. The Double-Take Availability for VMware Infrastructure service will run from this machine and will communicate with both the source and target servers to handle replication. You may want to consider protecting this machine with Double-Take Availability to keep the machine available because if it becomes unavailable, Double-Take Availability for VMware Infrastructure will be unable to replicate data between the source and target.
In addition to the Double-Take Availability for VMware Infrastructure service, you will need to install the Double-Take Availability for VMware Infrastructure console. The console can be installed on the same machine as the service or it can be installed on a different machine.
Use these instructions to install or upgrade an existing Double-Take Availability for VMware Infrastructure installation.
The Double-Take Availability installation program can accept command-line parameters which allow you to automate the installation or upgrade process by running an unattended, or silent, installation. The automatic process allows you to pass parameters through to the installation program instead of entering information manually during the installation or upgrade.
Since the automated process does not prompt for settings, the settings are manually defined in a configuration file called DTSetup.ini. By default, DTSetup.ini contains two sections. The second section can be duplicated as many times as necessary. The first section, [Config], applies to any server not defined in the second (or duplicate of second) sections. The second (or duplicate of second) section, [MachineName], allows you to specify unique settings for individual servers. You have to modify the heading name (case-sensitive) to identify the server.
|
[Config] DTSETUPTYPE=DTNT DTACTIVATIONCODE=123456789012345678901234 DOUBLETAKEFOLDER="C:\Program Files\Double-Take Software\Double-Take" QMEMORYBUFFERMAX=128 DISKQUEUEFOLDER="C:\Program Files\Double-Take Software\Double-Take" DISKQUEUEMAXSIZE=UNLIMITED DISKFREESPACEMIN=50 DTSERVICESTARTUP=1 PORT=6320 SET_FWPORT=Y
[Alpha] DTSETUPTYPE=DTNT DTACTIVATIONCODE=123456789012345678901234 DOUBLETAKEFOLDER="C:\Program Files\Double-Take Software\Double-Take" QMEMORYBUFFERMAX=128 DISKQUEUEFOLDER="C:\Program Files\Double-Take Software\Double-Take" DISKQUEUEMAXSIZE=UNLIMITED DISKFREESPACEMIN=50 DTSERVICESTARTUP=1 PORT=6320 SET_FWPORT=Y
[Beta] DTSETUPTYPE=DTNT DTACTIVATIONCODE=123456789012345678901234 DOUBLETAKEFOLDER="C:\Program Files\Double-Take Software\Double-Take" QMEMORYBUFFERMAX=128 DISKQUEUEFOLDER="C:\Program Files\Double-Take Software\Double-Take" DISKQUEUEMAXSIZE=UNLIMITED DISKFREESPACEMIN=50 DTSERVICESTARTUP=1 PORT=6320 SET_FWPORT=Y |
In the sample DTSetup file, the server Alpha would use the parameters defined under the [Alpha] heading. The server Beta would use the parameters defined under the [Beta] heading. All other servers would use the configuration under the [Config] section.
| Note: | Do not leave any parameter blank in the Config or MachineName sections. Otherwise, a hard-coded default stored in a Double-Take Availability .dll file will be used. |
Review the following table to understand the different parameters available in DTSetup.ini.
| Parameter | Valid Values |
|---|---|
| DTSetupType |
If you are installing on Windows Server Core or Windows Hyper-V Server (standalone), the setup type will be server components only regardless of your setting. |
| DTActivationCode | A 24 character, alpha-numeric activation code which applies the appropriate license to the server. Multiple activation codes can be separated by a semi-colon. |
| DoubleTakeFolder | Any valid path specifying the location of the Double-Take Availability files |
| QMemoryBufferMax | Any integer representing the amount of system memory, in MB, to use for memory-based queuing |
| DiskQueueFolder | Any valid path to the location of the disk-based queue. |
| DiskQueueMaxSize | Any integer representing the amount of disk space, in MB, to use for disk-based queuing or the keyword UNLIMITED which will allow the queue usage to automatically expand whenever the available disk space expands |
| DiskFreeSpaceMin | Any integer representing the amount of disk space, in MB, that must remain free at all times |
| DTServiceStartup |
This parameter is not applied if your DTSetupType is DTCO. |
| Port | Any integer between 1024 and 65535 that identifies the Windows Firewall port used for Double-Take Availability. |
| Set_FWPORT |
|
| Note: |
You must have Microsoft .NET installed on server before starting the automatic installation. If you are using Windows 2008, but you are not using the built-in administrator account, Windows 2008 User Access Control will prompt you to confirm you want to install Double-Take Availability. To work around this issue, use the built-in administrator account when you are installing to each server. You may also disable User Access Control if that is acceptable for your environment. |
setup /s /v"DTSETUPINI=\"c:\dtinstall\DTSetup.ini\" /qn"
setup_xxxx /s /v"DTSETUPINI=\"c:\dtinstall\DTSetup.ini\" /qn"
| Note: |
The command must be run from the directory where the temporary files are located as well as specifying that directory for the .ini file. Spacing is critical with this command. A space should precede /s, /v, and /qn but should not appear anywhere else for the command to work correctly. |
setup /s /v"DTSETUPINI=\"m:\DTSetup.ini\" /qn"
setup_xxxx /s /v"DTSETUPINI=\"m:\DTSetup.ini\" /qn"
| Note: |
The command must be run from the shared folder as well as specifying that directory for the .ini file. Substitute your mapped drive for m:\. Spacing is critical with this command. A space should precede /s, /v, and /qn but should not appear anywhere else for the command to work correctly. |
|
C:\>net use m: \\server_name\share The command completed successfully C:\>M: M:\>setup_1352 /s /v"DTSETUPINI=\"m:\DTSetup.ini\" /qn" |
If you want to use a GeoCluster configuration, where data is stored on volumes local to each node and replicated to each node in the cluster, complete the cluster configuration appropriate for the operating system you are using.
In a typical Windows 2003 MSCS shared disk cluster configuration, the quorum resource, by default, is the Local Quorum and is located on the first shared disk in the cluster. Because in a GeoCluster configuration there is no shared physical disk, the Local Quorum will not work as the quorum resource. You will need to choose one of the other Windows quorums. Review the following table to determine which quorum is appropriate for your environment.
| Note: | If you are upgrading from a previous GeoCluster version and were using GeoCluster as a quorum, you must select another quorum type. GeoCluster can no longer be used as a quorum resource. |
| Quorum Type | Description | GeoCluster Recommendation |
|---|---|---|
| Local Quorum | This quorum is for single node clusters and shared disk clusters. It cannot be used in a GeoCluster configuration. | |
| Majority Node Set | This quorum is for clusters with three or more nodes. | X |
| Majority Node Set with File Share Witness | This quorum is for clusters with only two nodes. If you are using Windows 2003 Service Pack 1 or earlier, see the Microsoft support article 921181 for an update for the File Share Witness. If you are using Service Pack 2 or later, the update is not needed. | X |
Use the following instructions as a guideline for configuring your Windows 2003 cluster. See your Windows cluster documentation as a complete reference.
The default quorum resource in a Windows 2008 environment will vary depending on your configuration (number of nodes, shared disks, and so on). The ideal quorum resource to use for GeoCluster is the Node and File Share Majority. There are other quorum types available. Review the following table to determine which quorum is appropriate for your environment.
| Quorum Type | Description | GeoCluster Recommendation |
|---|---|---|
| Node Majority | This quorum is recommended for clusters with an odd number of nodes. The cluster can handle failures of half of the nodes (rounding up) minus one and still stay online. | |
| Node and Disk Majority | This quorum is recommended for clusters with an even number of nodes. The cluster can handle failures of half of the nodes (rounding up), as long as the witness disk remains online, and still stay online. If the witness disk fails, the cluster can handle failures of only half of the nodes (rounding up) minus one and still stay online. | |
| Node and File Share Majority | This quorum is recommended for clusters with special configurations, such as GeoCluster. The cluster can handle failures of half of the nodes (rounding up), as long as the witness share remains online, and still stay online. If the witness share fails, the cluster can handle failures of only half of the nodes (rounding up) minus one and still stay online. | X |
| No Majority: Disk Only | This quorum is not usually recommended. The cluster can handle failures of all nodes except one and still stay online. |
Use the following instructions as a guideline for configuring your Windows 2008 cluster. See your Windows cluster documentation as a complete reference.
| Note: |
If you are creating a file server using clustered file shares, the path for the file share in the Failover Cluster Management wizard is case-sensitive. If the drive letter is uppercase, the path in the clustered file share wizard must also be uppercase. If the case does not match, the wizard will fail stating the path does not exist. |
The Double-Take Console is used to protect and monitor your servers and connections. Each time you open the Double-Take Console, you start at the Home page. This page provides a high-level overview of the status of your connections.
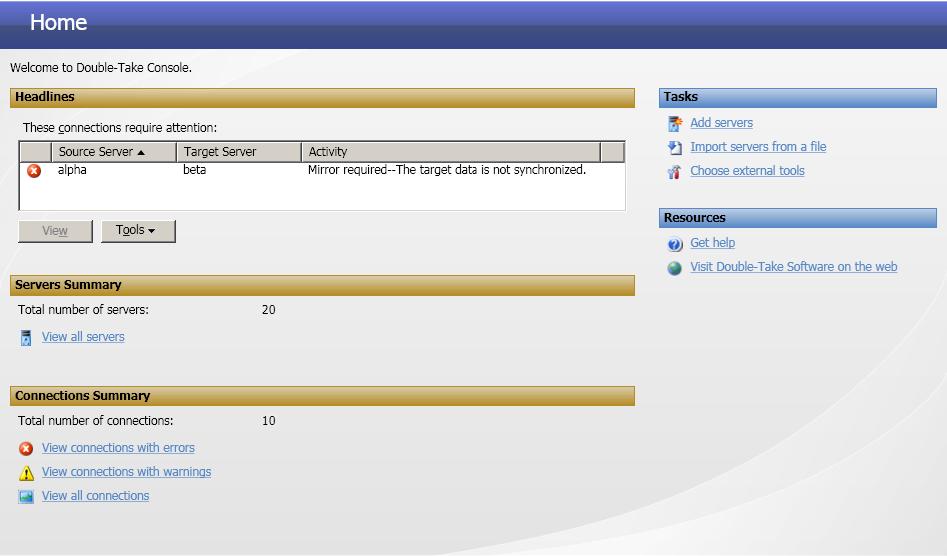
The appearance of the Home page is the same for all users. However, other console pages may have variances in the appearance or you may not see some pages at all. The pages and views depend on the Double-Take Software products that you have installed.
After you have installed the console, you can launch it by selecting Start, Programs, Double-Take, Double-Take Console.
The first time you start the console, it is empty. In order to protect and monitor your servers, you must insert your servers in the console. You can insert servers manually, through Active Directory discovery, or from a console server configuration file.
You will automatically be taken to the Manage Servers page.
You will automatically be taken to the Manage Servers page.
You can share the console server configuration between machines that have the Double-Take Console installed. The console server configuration includes the server name, server communications ports, user name, encrypted password, and other internal processing information.
After the configuration file is exported, you can import it to another console.
When you are importing a console server configuration file from another console, you will not lose or overwrite any servers that already exist in the console. For example, if you have server alpha in your console and you insert a server configuration file that contains servers alpha and beta, only the server beta will be inserted.
After the configuration file is imported, you will automatically be taken to the Manage Servers page.
To manage the servers in your console, select Manage Servers from the toolbar. The Manage Servers page allows you to view, add, edit, or remove servers from your console.
| Column | Description |
|---|---|
|
The first blank column indicates the status of communications between the console and the server.
|
|
|
The second blank column indicates the security level
|
|
| Server | The name of the server |
| Activity |
There are many different Activity messages that keep you informed of the server activity. Most of the activity messages are informational and do not require any administrator interaction. If you see error messages, check the server details. |
| Version | The product version information |
| Product | The products licensed for the server |
| Activation Code | The activation codes associated with the products licensed for the server |
| Toolbar Item | Description |
|---|---|

|
Add a new server. This button leaves the Manage Servers page and opens the Add Servers page |

|
View detailed information about a server. This button leaves the Manage Servers page and opens the View Server Details page |

|
Remove the server from the console |

|
Change the login credentials for a server |

|
View event messages for a server. This button leaves the Manage Servers page and opens the View Server Events page. |
To view details about a specific server, select View Server Details from the toolbar on the Manage Servers page. The View Server Details page allows you to view details about a particular server.
| Category | Server Detail Item | Description |
|---|---|---|
| Properties | Server name | The server name or IP address as added to the console |
| Status | There are many different Status messages that keep you informed of the server activity. Most of the status messages are informational and do not require any administrator interaction. If you see error messages, check the rest of the server details. | |
| Activity |
There are many different Activity messages that keep you informed of the server activity. Most of the activity messages are informational and do not require any administrator interaction. If you see error messages, check the rest of the server details. |
|
| Protocol |
|
|
| Port | The port used for communication with the server | |
| Version | The product version information | |
| Access | The security level granted to the specified user | |
| User name | The user account used to access the server | |
| Licensing |
Licensing information for the server
|
|
| Connections | Source connections | A list of any connections from this server. Double-clicking on a connection in this list will automatically open the View Connection Details page. |
| Target connections | A list of any connections to this server. Double-clicking on a connection in this list will automatically open the View Connection Details page. |
To view events associated with a specific server, select View Server Events from the toolbar on the Manage Servers page.The View Server Events page displays the same messages that are logged to the Windows Event Viewer. The list of events are displayed in the top pane of the page, although the Description is limited. When you highlight an event, the event details, including the full Description, are displayed in the bottom pane of the page.
You can filter the events displayed by using the Filter drop-down list or the View warning events and View error events toolbar buttons. To clear a filter, select All events in the Filter drop-down list. See Event messages for a complete list of the service and driver event messages.
To update the security credentials used for a specific server, select Provide Credentials from the toolbar on the Manage Servers page. When prompted, specify the User name, Password, and Domain of the account you want to use for this server. Click OK to save the changes.
To manage your VirtualCenter servers, select Go, Manage VirtualCenter Servers. The Manage VirtualCenter Server page allows you to view, add, remove, or edit credentials for your VirtualCenter servers available in the console.
| Column | Description |
|---|---|
| VirtualCenter Server | The name of the VirtualCenter server |
| Full Name |
The full name of the VirtualCenter server |
| User Name | The user account being used to access the VirtualCenter server |
| Toolbar Item | Description |
|---|---|

|
Add a new VirtualCenter server. When prompted, specify the VirtualCenter server and a user account. |
|
|
Remove the VirtualCenter server from the console. |
|
|
Edit credentials for the selected VirtualCenter server. When prompted, specify a user account to access the VirtualCenter server. |
There are several options that you can set that are specific to the Double-Take Console. To access these console options, select Options from the toolbar.
To access the console refresh rate, select Options from the toolbar. On the Options page, Monitoring interval specifies how often, in seconds, the console refreshes the monitoring data. The servers will be polled at the specified interval for information to refresh the console.
To access the console communications port, select Options from the toolbar. On the Options page, Default port specifies the port that the console will use when sending and receiving data to Double-Take servers. By default, the port is 6325. Changes to the console port will not take effect until the console is restarted.
| Note: | If you are using an older Double-Take version, you will need to use the legacy protocol port. This applies to Double-Take versions 5.1 or earlier. |
By default, each time the console is started, it will automatically check the Double-Take Software web site to see if there is updated console software available. If there is updated console software available, an Automatic Updates section will appear on the Home page. Click Get the latest update to download and install the updated console software.
If you want to disable the automatic check for updates, click Change automatic updates or select Options from the toolbar. On the Options page, deselect Automatically check for updates to disable the automatic check.
You can also manually check for updates by selecting Help, Check for Updates.
There are various Double-Take Availability consoles, many of which are being phased out over time. To help consolidate the consoles and help you locate the necessary workflows to complete your work, use the console called Double-Take Console.
To access this console, select Start, Programs, Double-Take, Double-Take Console. Select Get Started from the toolbar and then select the type of workload protection you want to establish. The appropriate workflow or console will then open.
Use the following links to find more information on the other consoles available.
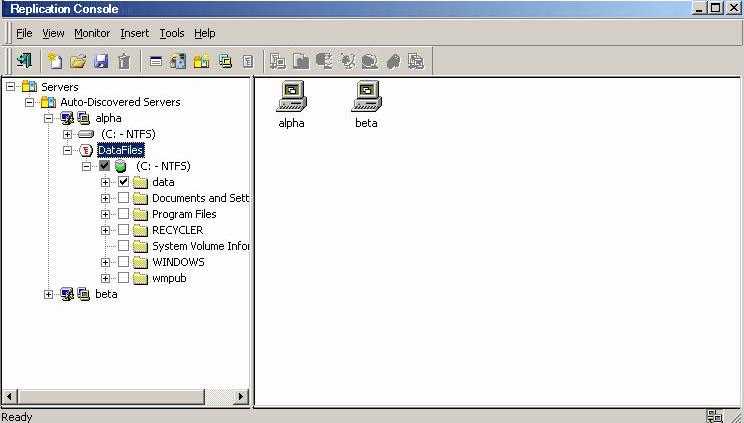
To open the Replication Console, select Start, Programs, Double-Take, Double-Take Replication Console.
From the Replication Console, you can manage, monitor, and control your data workload connections. The Replication Console is a two pane view. The views in the panes change depending on what is highlighted. For example, when the root of the tree in the left pane is selected, all of the machines in your environment running Double-Take Availability are displayed in the right pane. If you expand the tree in the left pane and select a server, any connections for that server are displayed in the right pane.
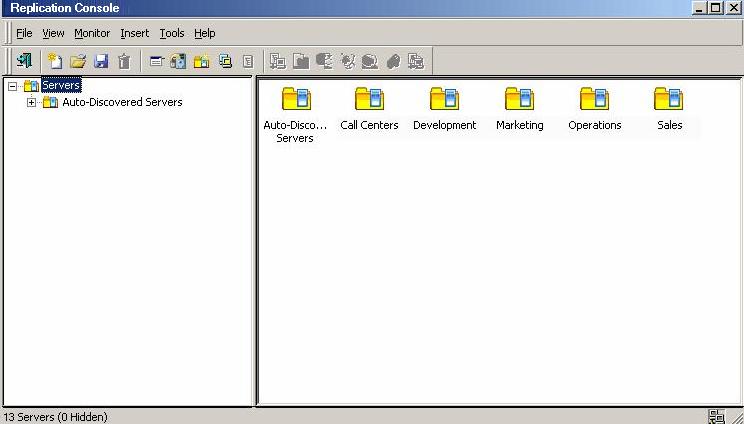
| Note: |
You may not have access to some of the components or see certain display options if you are using a newer version of the Replication Console to control an older version of your source or target. If you are logged in locally to the machine running the Replication Console, there will be no servers automatically populated in the Servers tree. You will have to manually insert each server. |
To ensure protection of your data, Double-Take Availability offer multi-level security using native operating system security features. Privileges are granted through membership in user groups defined on each machine running Double-Take Availability. To gain access to a particular Double-Take Availability source or target, the user must provide a valid operating system user name and password and the specified user name must be a member of one of the Double-Take Availability security groups. Once a valid user name and password has been provided and the Double-Take Availability source or target has verified membership in one of the Double-Take Availability security groups, the user is granted appropriate access to the source or target and the corresponding features are enabled in the client. Access to Double-Take Availability is granted on one of the following three levels.
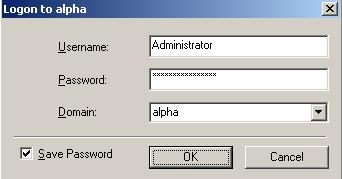
| Note: |
When logging in, the user name, password, and domain are limited to 100 characters. If your activation code is missing or invalid, you will be prompted to open the Server Properties General tab to add or correct the code. Select Yes to open the Server Properties dialog box or select No to continue without adding an activation code. If the login does not complete within 30 seconds, it is automatically canceled. If this timeout is not long enough for your environment, you can increase it by adjusting the Communication Timeout on the Configuration tab of the Replication Console properties. Select File, Options, from the Replication Console to access this screen. Double-Take Availability uses ICMP pings to verify server availability during the login process. If your Double-Take Availability server is across a router or firewall that has ICMP pings disabled, you will need to disable the Double-Take Availability ICMP ping verification. To do this, select File, Options, from the Replication Console and disable Use ICMP to verify server availability. Double-Take Availability uses the current user's login credentials to attempt to log in to servers. This is called a unified login. If you want to disable unified logins, select File, Options, from the Replication Console and enable Use Named Pipes for Login. |
| Icon | Description | Access Granted |
|---|---|---|
|
|
This icon is a computer with a gear and it indicates the Double-Take Availability security is set to administrator access. | Administrator rights |
|
|
This icon is a computer with a magnifying glass and it indicates the Double-Take Availability security is set to monitor only access. | Monitor rights |
|
|
This icon is a lock and it indicates the Double-Take Availability security is set to no access. | No rights |
To better manage the servers that appear in the Replication Console, you can customize the server display to fit your needs. You can create groups and move servers to those groups to help you organize your environment. Within the groups, you can insert, remove, hide or unhide servers. Each of these functions is detailed in the following sections.
The left pane of the Replication Console is a tree view of the Double-Take Availability servers. By default, the first group in the tree is the Discovered Servers group. All Double-Take Availability servers that are automatically discovered will be added to this group. Use server groups in a hierarchical structure to help you organize your environment.
Use one of the following methods to create a new group:
The location of the new group that is created will depend on what was highlighted. If the root of the tree was highlighted, the new group will be created as a child of the root. If a group or server within a group was highlighted, the new group will be created as a child of that group. Name the newly inserted group with a unique name by typing over the default name and pressing Enter. This process is similar to naming a new folder in Windows Explorer. You can also rename an established group by double-clicking on the existing name. Type the new group name over the existing name and press Enter.
You will prompted to confirm the removal of the group and its subgroups and any servers (displayed or hidden) contained in them. Click OK.
If Active Directory discovery is enabled on the Replication Console, those servers that have Active Directory advertisement enabled will automatically be repopulated back in the default Discovered Servers group. If Active Directory discovery is disabled on the Replication Console or for individual servers, servers will need to be manually inserted into the Replication Console.
| Note: |
The Remove toolbar button also removes servers and replication sets, so make sure you have the correct item highlighted before clicking the toolbar button. You cannot remove the default Discovered Servers group. |
Within your server groups, you have the ability to further manage the servers that are displayed by using the following functions.
Servers that are auto-populated can be moved to different groups within the Replication Console tree. You can move servers to groups by either of the following methods
A Double-Take Availability server will only appear once within the entire Replication Console tree. Servers cannot be placed into multiple groups.
If a machine is not displayed on the Replication Console, it can be manually inserted. This feature is useful for machines that are across a router or on a different network segment.
| Note: |
If a machine is manually inserted into the Replication Console, it will automatically be saved in your workspace and will appear the next time the Replication Console is started. |
Use the following instructions to insert a server into the Replication Console.
Even if a machine is not running Double-Take Availability, you can still insert it in the Replication Console.
If you do not want to see a server in the Replication Console, it can be permanently removed from the display. You might need to remove a server that was manually added, if that server is no longer needed. Or if there are servers within the network that another administrator is responsible for, you can remove them from your display.
If a server is listed in Active Directory and Active Directory discovery is enabled, a removed server will automatically be added back to the server list .
To remove a server, right-click on the server in the left or right pane of the Replication Console and select Remove. You can also select Remove Item from the toolbar.
If Active Directory discovery is enabled on the Replication Console, those servers that have Active Directory advertisement enabled will automatically be repopulated back in the default Discovered Servers group. If Active Directory discovery is disabled on the Replication Console or for individual servers, servers will need to be manually inserted into the Replication Console.
| Note: |
The Remove toolbar button also removes servers and replication sets, so make sure you have the correct item highlighted before clicking the toolbar button. You cannot remove the default Discovered Servers group. |
If you do not want to see a server in the Replication Console and do not want to disable Active Directory discovery, you can hide the server from view. This keeps the server in the Replication Console’s internal list of servers, but does not display it in the server tree, any dialog boxes, or any field/menu selections.
To hide a server, right-click on a server in the left or right pane of the Replication Console and select Hide.
| Note: |
If you attempt to insert a server that is already in the tree but hidden, you will be prompted to unhide the server and insert it into the selected group. Be careful if you hide a server with an established Double-Take Availability connection. If that connection goes into an error state, you will not be able to see the connection in the Replication Console. The Double-Take Availability log, Event Viewer, and other monitoring methods will still be functioning to alert you to the error. Hiding the server only removes it from the Replication Console display. If a target server with an established Double-Take Availability connection is hidden and you open the Connection Manager for that connection via the source, you will see the target and IP address displayed in the Target and Route fields, respectively. This is the only time you will see a hidden server. |
You can unhide, or display, a hidden server at any time you want to access that server. The server will be displayed in the server tree, all dialog boxes, and field/menu selections.
To unhide, or display, a hidden server, you can insert the server or use the following instructions.
Before moving a group that contains at least one subgroup with at least two hidden servers, you must unhide all of the servers. After the servers have been unhidden, move the group and then hide the servers again. Any attempt to move a group containing subgroups with hidden servers will result in an error when saving the workgroup or exiting the Replication Console.
All of the group and server information is stored on the local machine for each user. When you close the Replication Console, the group information is saved and will be persisted the next time you open the Replication Console on this machine. If you want to share the group configuration with another user or machine, you can export the group configuration information (File, Export server group configuration) to an .xml file. That file can then be copied and imported (File, Import server group configuration) by another user on this machine or to another machine.
The Replication Console workspace contains the display of the panes of the Replication Console and any servers that may have been inserted. Multiple workspaces can be used to help organize your environment or to view settings from another machine.
As you size, add, or remove windows in the Replication Console, you can save the workspace to use later or use on another Double-Take Availability client machine. Select File and one of the following options.
From the Replication Console, you can open a new workspace or open a previously saved workspace. Select File and one of the following options.
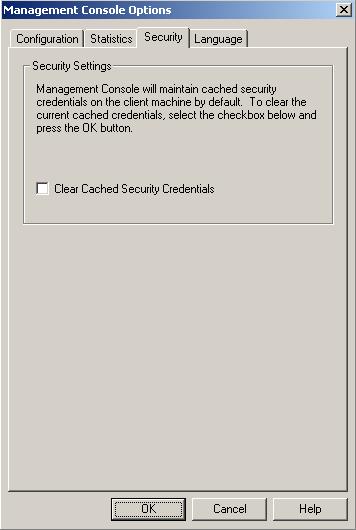
To remove cached credentials, select File, Options and select the Security tab. To remove the security credentials, enable Clear Cached Security Credentials and then click OK.
To open the Failover Control Center, select Start, Programs, Double-Take, Availability, Double-Take Availability Failover Control Center.
The Failover Control Center should be run from your target server or a client machine. Do not run the Failover Control Center from your source server.
From the Failover Control Center, you can manage, monitor, and control failover for your Double-Take Availability servers. The Failover Control Center displays a main window for monitoring failover activity. Control buttons to the right allow you to configure and manage your servers.
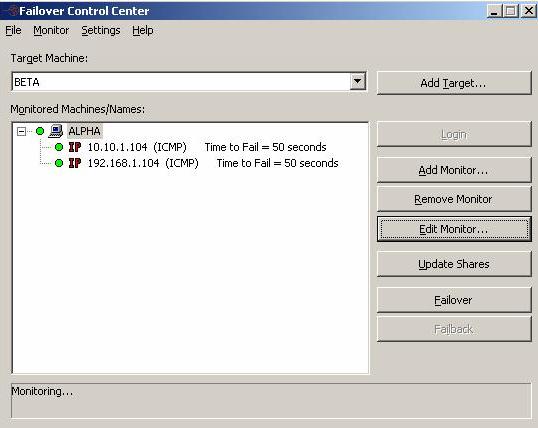
The Failover Control Center uses port 6320, by default for Double-Take Availability communications. To view or modify the port settings in the Failover Control Center, select Settings, Communications.
The failover client periodically requests information from the source and target. Depending on the type of information, the request may be a machine-specific request, like obtaining the Time to Fail status from a target, or may be a general request, like determining which machines are running Double-Take Availability.
The rate at which these requests are made can be modified through the Failover Control Center refresh rate dialog box. Select Settings, Refresh Rate. The default update interval is one second. A lower refresh rate value updates the information in the Failover Control Center window's Monitored Machines tree more often, but also generates more network traffic and higher utilization on the client and target machines. A higher refresh rate value updates the information less frequently, but minimizes the network traffic.
To remove cached credentials, access the credentials security option, by selecting Settings, Security. To remove the security credentials, enable Clear Cached Security Credentials and then click OK.
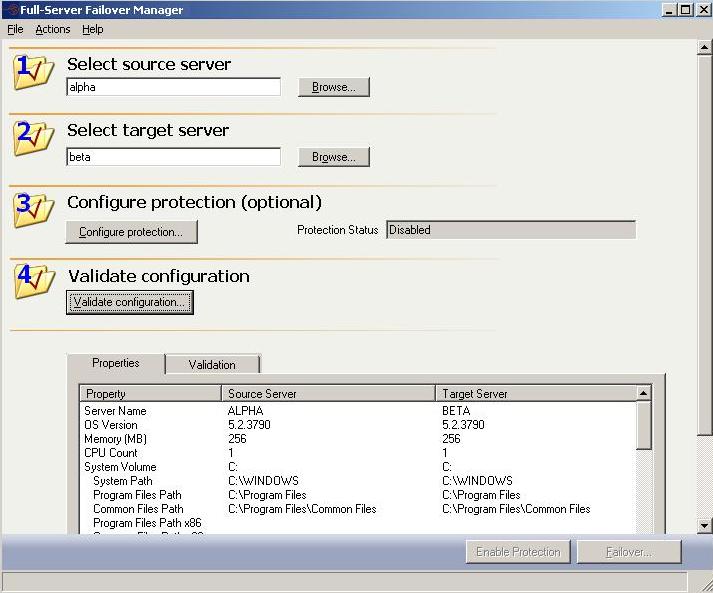
To open the Full-Server Failover Manager, select Start, Programs, Double-Take, Availability, Double-Take Availability Full-Server Failover Manager.
The Full-Server Failover Manager allows you to create your source and target connection, monitor your full-server workload protection, manage your full-server snapshots, and initiate full-server failover.
The client is a simple interface with four numbered steps. Steps 1 and 2 for the source and target have to be completed before the other steps are available or the Protection Status is displayed.
Select File, Options. By default, the main window of Full-Server Failover Manager will automatically update every five (5) seconds. If desired, you can modify the Refresh Interval. You can also refresh the main window manually by selecting File, Refresh.
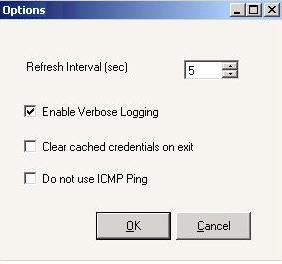
Select File, Options. By default, Full-Server Failover Manager creates a log that maintains all processing information. If desired, you can disable the option Enable Verbose Logging so that only basic processing information is logged.
Select File, Options. By default, Full-Server Failover Manager will save the user credentials supplied for each servers. If desired, you can enable Clear cached credentials on exit so they are not saved. You can also clear the user credentials manually by selecting File, Clear Cached Credentials.
Select File, Options. By default, Full-Server Failover Manager will use ICMP pings to check for server availability. If you do not want to use ICMP pings, select Do not use ICMP Ping. When this option is selected, the Full-Server Manager will use the Double-Take service to check for server availability.
After you have created a protection pair and configured any of the optional settings you can save those settings so that you can reuse them for future pairs of servers. Once you have the settings the way you want them, save them by selecting File, Defaults, Save Current Settings as Defaults. This creates a file called FFMDefaults.xml, which will automatically be the default settings the next time you use the Full-Server Failover Manager. If desired, you can rename the FFMDefaults.xml file and then save a new set of defaults to FFMDefaults.xml to be used by the Full-Server Failover Manager. This would allow you to have multiple failover configurations, which can be more easily interchanged. You can also use these different files to initiate failovers without using the Full-Server Failover Manager GUI.
| Note: | Because network adapters are uniquely identified on each server, the Network Mappingis not stored in the default settings |
If you want to reset the configuration settings back to the default settings, select File, Defaults, Reset Defaults.
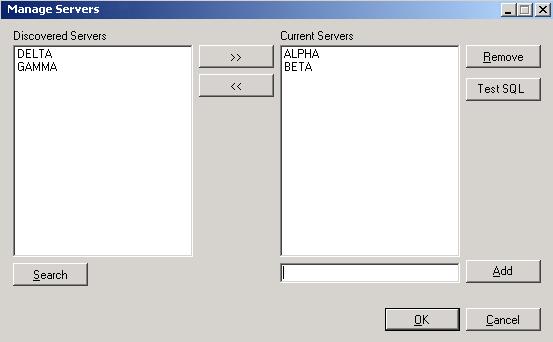
To open the Application Manager, select Start, Programs, Double-Take, Availability, Double-Take Availability Application Manager.
| Note: |
You can also start the Application Manager from the command line.
|
The Application Manager allows you to establish application protection, monitor that protection, and initiate application failover and failback.
When you select an application to protect in the Tasks list on the left pane, the Setup tab on the right pane is a simple interface with four numbered steps. Steps 1 and 2 are for the domain and servers. Step 3 is optional configuration and step 4 validates the servers.
After protection has been established, use the Monitor tab to check on the status of your protection.
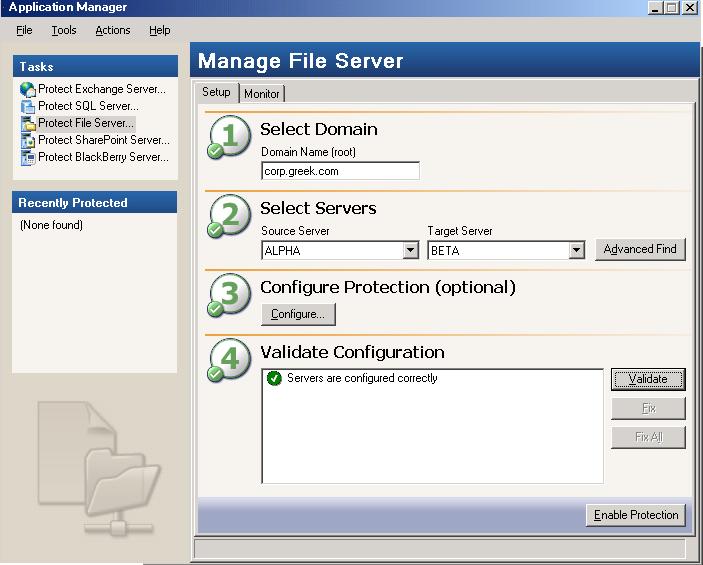
Step 2 of the application protection workflow is to select your source and target servers. If no servers are populated in the lists (perhaps the server you need is in a child domain), click Advanced Find to add servers to the lists. Advanced Find is not available for all application protections.
To modify Application Manager options, select Tools, Options and modify any of the following options.
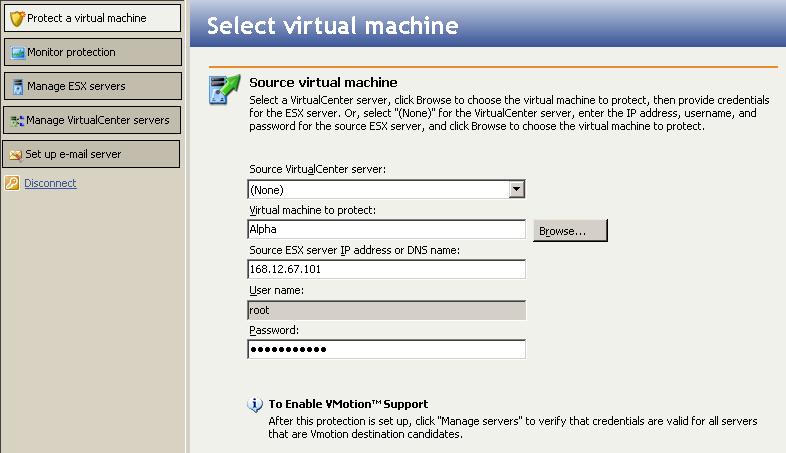
To open the Double-Take Availability for VMware Infrastructure console, select Start, Programs, Double-Take, Availability, Double-Take Availability for VMware Infrastructure.
The first time you use the console or if you have not saved your login information, you will be prompted to provide login information. Specify the Server, which is the machine running the Double-Take Availability for VMware Infrastructure service, and a User name and Password. If you do not want to provide login information each time you open the console, enable Save DTAVI connection information.
The Double-Take Availability for VMware Infrastructure console allows you to establish protection of host-level virtual disk files (the .vmdk files) from an ESX source to an ESX target. You can also initiate failover and failback.
The left pane is a tasks-style pane. When an item in the left pane is selected, the right pane of the console display updates to the corresponding workflow or page.
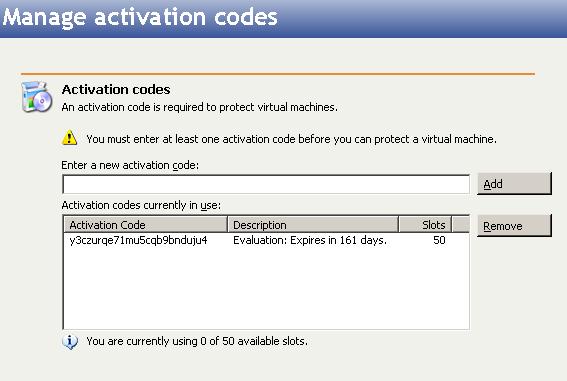
You can manage your Double-Take Availability for VMware Infrastructure activation codes by selecting Go, Manage activation codes.
|
Enter a new activation code and click Add. To remove a code, highlight in the list and click Remove.
Each activation code corresponds to a number of slots, where each slot represents the capacity to protect a single virtual machine in your environment. Each time protection is established, Double-Take Availability for VMware Infrastructure will update the available number of slots for subsequent protections.
|
Note: |
If you are using VMware bundle licensing, each slot represents an ESX server, rather than a protection. Therefore, entering an ESX host by IP address and again by DNS name will cause a duplicate entry using an additional license slot. Therefore, when you add ESX servers, enter either the IP address or the DNS name but not both. |
To manage your VirtualCenter servers, select Manage VirtualCenter servers from the left pane of the console.
To manage your ESX servers, select Manage ESX servers from the left pane of the console. Double-Take Availability for VMware Infrastructure scans to find ESX servers that are VMotion destination candidates, based upon SAN connectivity. The Credentials Cached column in the table identifies servers that need to have credentials added. To add the credentials, highlight a server in the list and click Configure ESX server on the toolbar. On the Configure ESX server page, add, edit, or remove a user. If prompted, specify the password associated with the user. Click Done to save the modficiations.
If you need to add an ESX server, click Add ESX server on the toolbar. On the Add ESX server page, specify the VirtualCenter server, the IP address or DNS name of the ESX server, a User name. and Password. Click Save to insert the ESX server.
If you need to remove an ESX server, highlight an ESX server in the list and click Remove ESX server.
To set up an e-mail server, select Set up e-mail server from the left pane of the console. E-mail configuration applies to all protection jobs. Specify the e-mail server configuration.
Click Save to save your settings.
Double-Take Availability flexible configurations allow you to protect different workloads depending on the needs of your organization.
Protecting specific data consists of two main tasks - creating a replication set (to identify the data to protect) and connecting that replication set to a target.
You have the following data protection options.
Once your connection is established, move on with Data workload failover to ensure high availability.
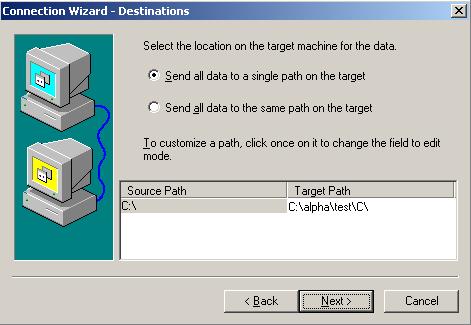
The Connection Wizard guides you through the process of protecting your data. It helps you select a source, identify the data from your source that will be included in the replication set, and select a target.
| Note: | If the Servers root is highlighted in the left pane of the Replication Console, the Connection Wizard menu option will not be available. To access the menu, expand the server tree in the left pane, and highlight a server in the tree. |
| Note: | At any time while using the Connection Wizard, click Back to return to previous screens and review your selections. |
| Note: |
Double-Take Availability will automatically attempt to log on to the selected source using the identification of the user logged on to the local machine. If the logon is not successful, the Logon dialog box will appear prompting for your security identification. When logging in, the user name, password, and domain are limited to 100 characters. |
| Note: |
Double-Take Availability will automatically attempt to log on to the selected target using the identification of the user logged on to the local machine. If the logon is not successful, the Logon dialog box will appear prompting for your security identification. When logging in, the user name, password, and domain are limited to 100 characters. |
Before you can establish a connection, you must create a replication set.
| Note: |
The default number of files that are listed in the right pane of the Replication Console is 2500, but this is user configurable. A larger number of file listings allows you to see more files in the Replication Console, but results in a slower display rate. A smaller number of file listings displays faster, but may not show all files contained in the directory. To change the number of files displayed, select File, Options and adjust the File Listings slider bar to the desired number. To hide offline files, such as those generated by snapshot applications, select File, Options and disable Display Offline Files. Offline files and folders are denoted by the arrow over the lower left corner of the folder or file icon. |
| Note: | Be sure and verify what files can be included by reviewing Replication capabilities. |
After you have created a replication set, you can establish a connection through the Connection Manager by connecting the replication set to a target.
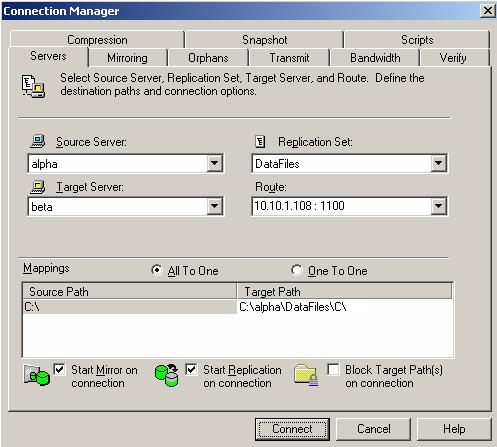
| Note: |
If you are mirroring and replicating dynamic volumes or mount points, your location on the target must be able to accommodate the amount of data that you are replicating. If you are mirroring and replicating sparse files and your location on the target is a non-NTFS 5 volume, the amount of disk space available must be equal to or greater than the entire size of the sparse file. If you are mirroring and replicating to an NTFS 5 volume, the amount of disk space available must be equal to or greater than the on-disc size of the sparse file. If you are mirroring and replicating multiple mount points, your directory mapping must not create a cycle or loop. For example, if you have the c: volume mounted at d:\c and the d: volume mounted at c:\d, this is a circular configuration. If you create and connect a replication set for either c:\d or d:\c, there will be a circular configuration and mirroring will never complete. |
| Warning: | Data integrity cannot be guaranteed without a mirror being performed. This option is recommended for the initial connection. |
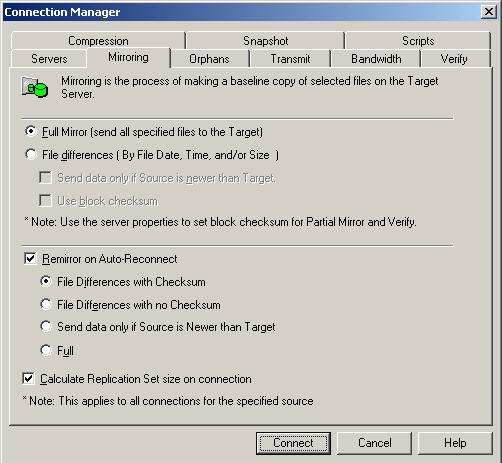
| Note: | If you are using a database application, do not use the newer option unless you know for certain you need it. With database applications, it is critical that all files, not just some of them that might be newer, get mirrored. |
| Note: | Stopping, starting, pausing, or resuming mirroring contains a comparison of how the file difference mirror settings work together, as well as how they work with the global checksum setting on the Source tab of the Server Properties. |
| Note: | Stopping, starting, pausing, or resuming mirroring contains a comparison of how the file difference mirror settings work together, as well as how they work with the global checksum setting on the Source tab of the Server Properties. |
| Note: | Database applications may update files without changing the date, time, or file size. Therefore, if you are using database applications, you should use the File Differences with checksum or Full option. |
| Note: |
The settings on the other tabs of the Connection Manager are advanced settings. You can modify any of them before or after establishing your connection. If you decide to enable orphan file processing while you are establishing your connection, orphan files will not be immediately processed when you create the connection. This setting is for processes that are run after a connection is already established (remirror, auto-remirror, verification, and so on). |
If your source and target are on opposite sides of a NAT or firewall, you will need special configurations to accommodate the complex network environment. Additionally, you must have the hardware already in place and know how to configure the hardware ports. If you do not, see the reference manual for your hardware.
In this environment, you must have static mapping where a single, internal IP address is always mapped in a one-to-one correlation to a single, external IP address. Double-Take Availability cannot handle dynamic mappings where a single, internal IP address can be mapped to any one of a group of external IP addresses managed by the router.
| Note: | If you change any of the port settings, you must stop and restart the Double-Take service for the new port setting to take effect. |
Since there are many types of hardware on the market, each can be configured differently. See your hardware reference manual for instructions on setting up your particular router.
Double-Take Availability offers a simple way for you to simulate a connection in order to generate statistics that can be used to approximate the time and amount of bandwidth that the connection will use when actively established. This connection uses the TDU (Throughput Diagnostics Utility), which is a built-in null (non-existent) target to simulate a real connection. No data is actually transmitted across the network. Since there is no true connection, this connection type helps you plan for a disaster recovery solution.
Before and after simulating your connection, you should gather network and system information specific to Double-Take Availability operations. Use the DTInfo utility to automatically collect this data. It gathers Double-Take Availability log files; Double-Take Availability and system settings; network configuration information such as IP, WINS and DNS addresses; and other data which may be necessary in evaluating Double-Take Availability performance. The DTInfo utility can be found on the product CD, in the Double-Take Availability installation directory, or on the Double-Take Software support web site.
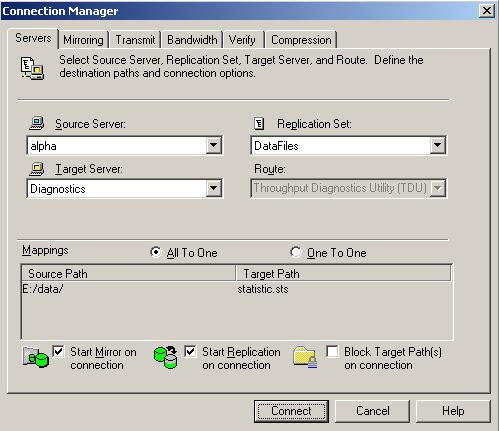
When you established your data workload protection, you only protected the data. You still need to establish failover monitoring, so that the target can stand in for the source in the event of a source failure, and your end users can access the data from the target.
| Note: |
If the target you need is not listed, click Add Target and manually enter a name or IP address (with or without a port number). You can also select the Browse button to search for a target machine name. Click OK to select the target machine and return to the Failover Control Center main window. |
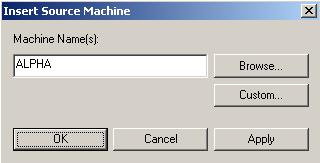
The Insert Source Machine dialog closes and the Monitor Settings dialog remains open with your source listed in the Names to Monitor tree.
| Note: |
To achieve shorter delays before failover, use lower Monitor Interval and Missed Packets values. This may be necessary for IP addresses on machines, such as a web server or order processing database, which must remain available and responsive at all times. Lower values should be used where redundant interfaces and high-speed, reliable network links are available to prevent the false detection of failure. If the hardware does not support reliable communications, lower values can lead to premature failover. To achieve longer delays before failover, choose higher values. This may be necessary for IP addresses on slower networks or on a server that is not transaction critical. For example, failover would not be necessary in the case of a server restart. |
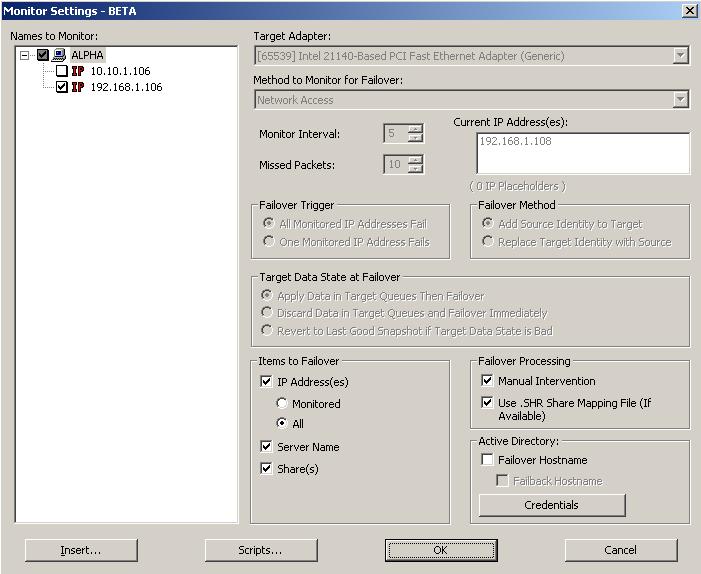
| Note: |
If you are monitoring multiple IP addresses, IP address conflicts may occur during failover when the number of IP addresses that trigger failover is less than the number of IP addresses that are assumed by the target during failover. For example, if a source has four IP addresses (three public and one private), and two of the three public addresses are monitored, but all three public addresses are configured to failover, a conflict could occur. If the source fails, there is no conflict because all of the IP addresses have failed and no longer exist. But if the failure only occurs on one of the monitored addresses, the other two IP addresses are still affected. If all of the addresses are failed over, these addresses then exist on both the source and the target. Therefore, when a source machine has fewer IP addresses that trigger failover than IP addresses that will be failed over, there is a risk of an IP address conflict. If your network environment is a WAN configuration, do not failover your IP addresses unless you have a VPN infrastructure so that the source and target can be on the same subnet, in which case IP address failover will work the same as a LAN configuration. If you do not have a VPN, you can automatically reconfigure the routers via a failover script (by moving the source's subnet from the source's physical network to the target's physical network). There are a number of issues to consider when designing a solution that requires router configuration to achieve IP address failover. Since the route to the source's subnet will be changed at failover, the source server must be the only system on that subnet, which in turn requires all server communications to pass through a router. Additionally, it may take several minutes or even hours for routing tables on other routers throughout the network to converge. |
| Note: |
Automatic share failover only occurs for standard Windows file system shares. Other shares must be configured for failover through the failover scripts or created manually on the target. See Macintosh shares or NFS Shares for more information. If you are failing over Windows shares but your source and target do not have the same drive letters, you must use the All to One selection when establishing your Double-Take Availability connection. Otherwise, the shares will not be created on the target during failover. If a Windows share is created on Windows 2003 with the default full access permissions (without an ACL) and then failed over, the permissions given to the target will be read-only permissions. Windows share information is automatically updated on the target once an hour. If you need to manually update the share information, click Update Shares on the main Failover Control Center window after the monitor has been established. |
| Note: |
If the Shares selection under Items to Failover is not selected, shares will not be failed over to the target regardless of the Use .SHR Share Mapping File selection. |
| Note: |
The Active Directory account password cannot be blank. |
| Note: |
Failover scripts will run but will not be displayed on the screen if the Double-Take service is not set to interact with the desktop. Enable this option through the Services applet. With these flexible scripting features, application failover using Double-Take Availability can be seamless to the end user. Double-Take Software tests many of the popular applications on the market today. The results of these testing procedures are written up into formal Application Notes that describe how Double-Take Availability should be configured to work correctly with certain applications, including scripting examples. For a complete list of Double-Take Availability Application Notes, visit the Double-Take Software support web site. |
Share information on the target can be manually updated from the Failover Control Center window. To manually update the share information, highlight a source machine in the Monitored Machines tree and click the Update Shares button.
If you want to edit the monitor settings for a source that is currently being monitored, highlight that source on the Monitored Machines tree on the main Failover Control Center screen and click Edit. The Monitor Settings dialog box will open. Follow the Configuring failover monitoring instructions.
If you want to discontinue monitoring a source, highlight that machine on the Monitored Machines tree on the main Failover Control Center screen and click Remove Monitor. No additional dialog boxes will open.
Most of the Double-Take Availability server settings are located in the Replication Console Server Properties dialog box. To access this dialog box, right-click a server in the left pane of the Management Console and select Properties. The Server Properties dialog box contains multiple tabs with the Double-Take Availability server settings. For information on the server settings not available through the Replication Console, see the Scripting Guide.
This section contains the following topics, each corresponding to a tab in the Server Properties dialog box.
From the Replication Console, you can see server identity information, including a server's Double-Take Availability activation code.
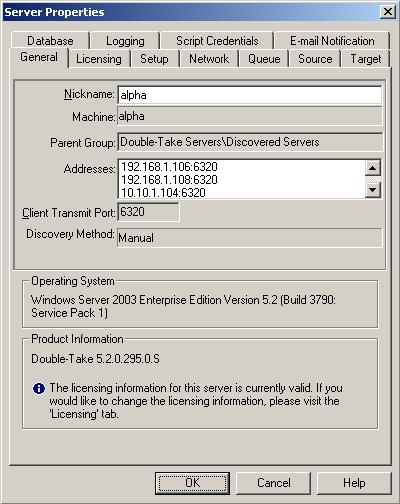
From the Replication Console, you can manage your server activation codes. The activation code is the Double-Take Availability license which is required on every Double-Take Availability server. The activation code is a 24 character, alpha-numeric code. You can change your activation code without reinstalling, if your license changes. There are different licenses available.
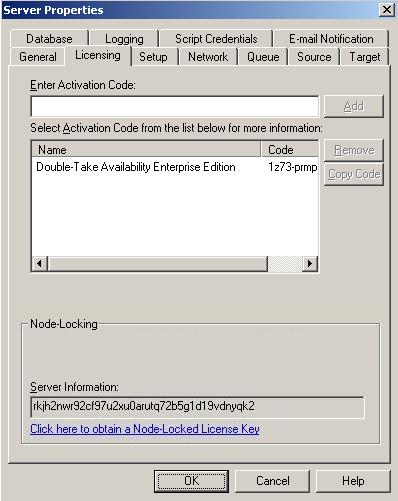
From the Replication Console, you can configure server startup options for each Double-Take Availability server.
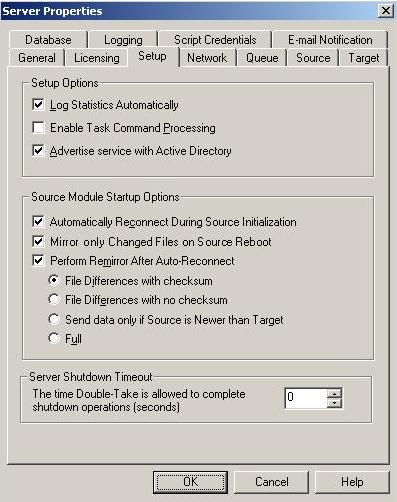
Task command processing can be enabled from the Replication Console, but it can only be initiated through the scripting language. See the Scripting Guide for more information.
If you disable this option on a source server, you can still submit tasks to be processed on a target, although task command processing must be enabled on the target.
| Note: |
Database applications may update files without changing the date, time, or file size. Therefore, if you are using database applications, you should use the File Differences with checksum or Full option. |
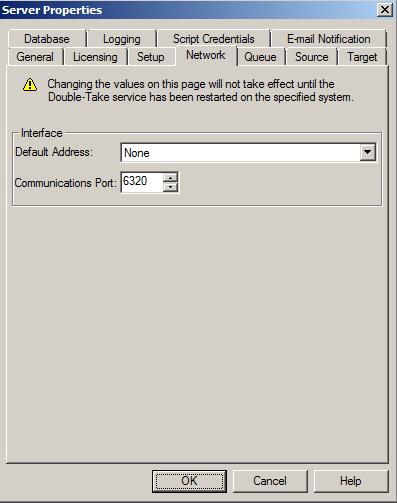
You should configure queuing on both the source and target.
Specify the queue settings for the server.
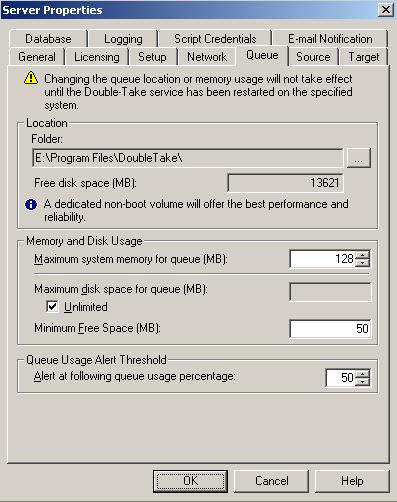
Folder—This is the location where the disk queue will be stored. Double-Take Availability displays the amount of free space on the volume selected. Any changes made to the queue location will not take effect until the Double-Take service has been restarted on the server.
When selecting the queue location, keep in mind the following caveats.
Although the read/write ratio on queue files will be 1:1, optimizing the disk for write activity will benefit performance because the writes will typically be occurring when the server is under a high load, and more reads will be occurring after the load is reduced. Accordingly, use a standalone disk, mirrored (RAID 1) or non-parity striped (RAID 0) RAID set, and allocate more I/O adapter cache memory to writes for best performance. A RAID 5 array will not perform as well as a mirrored or non-parity striped set because writing to a RAID 5 array incurs the overhead of generating and writing parity data. RAID 5 write performance can be up to 50% less than the write performance of a single disk, depending on the adapter and disk.
Another option is to use a solid state disk, which are hard drives that use RAM instead of disk platters. These devices are typically quite costly, but they will provide superior performance as a queuing device when the best performance is required.
| Note: | Scanning the Double-Take Availability queue files for viruses can cause unexpected results. If anti-virus software detects a virus in a queue file and deletes or moves it, data integrity on the target cannot be guaranteed. As long as you have your anti-virus software configured to protect the actual production data, the anti-virus software can clean, delete, or move an infected file and the clean, delete, or move will be replicated to the target. This will keep the target from becoming infected and will not impact the Double-Take Availability queues. |
Maximum system memory for queue—This is the amount of Windows system memory, in MB, that will be used to store data in queues. When exceeded, queuing to disk will be triggered. This value is dependent on the amount of physical memory available but has a minimum of 32 MB. By default, 128 MB or 512 MB of memory is used, depending on your operating system. If you set it lower, Double-Take Availability will use less system memory, but you will queue to disk sooner which may impact system performance. If you set it higher, Double-Take Availability will maximize system performance by not queuing to disk as soon, but the system may have to swap the memory to disk if the system memory is not available.
Since the source is typically running a production application, it is important that the amount of memory Double-Take Availability and the other applications use does not exceed the amount of RAM in the system. If the applications are configured to use more memory than there is RAM, the system will begin to swap pages of memory to disk and the system performance will degrade. For example, by default an application may be configured to use all of the available system memory when needed, and this may happen during high-load operations. These high-load operations cause Double-Take Availability to need memory to queue the data being changed by the application. In this case, you would need to configure the applications so that they collectively do not exceed the amount of RAM on the server. Perhaps on a server with 1 GB of RAM running the application and Double-Take Availability, you might configure the application to use 512 MB and Double-Take Availability to use 256 MB, leaving 256 MB for the operating system and other applications on the system. Many server applications default to using all available system memory, so it is important to check and configure applications appropriately, particularly on high-capacity servers.
Any changes to the memory usage will not take effect until the Double-Take service has been restarted on the server.
| Note: | The Maximum disk space for queue and Minimum Free Space settings work in conjunction with each other. For example, assume your queues are stored on a 10 GB disk with the Maximum disk space for queue set to 10 GB and the Minimum Free Space set to 500 MB. If another program uses 5 GB, Double-Take Availability will only be able to use 4.5 GB so that 500 MB remains free. |
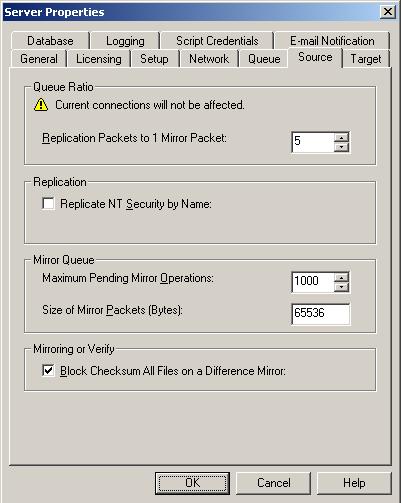
If you enable this option, make sure that the same groups and users exist on the target as they do on the source. Additionally, you must enable this option on your target server before starting a restoration, because the target is acting like a source during a restoration.
Enabling this option may have an impact on the rate at which Double-Take Availability can commit data on the target. File security attributes are sent to the target during mirroring and replication. The target must obtain the security ID (SID) for the users and groups that are assigned permissions, which takes some time. If the users and groups are not on the target server, the delay can be substantial. The performance impact enabling this option will have will vary depending on the type of file activity and other variables. For instance, it will not affect the overall performance of large database files much (since there is a lot of data, but only a few file permissions), but may affect the performance of user files significantly (since there are often thousands of files, each with permissions). In general, the performance impact will only be noticed during mirrors since that is when the target workload is greatest.
Regardless of the security model you are using, if you create new user accounts on the source, you should start a remirror so the new user account information associated with any files in your replication set can be transmitted to the target.
| Note: |
Database applications may update files without changing the date, time, or file size. Therefore, if you are using database applications, you should use the Block Checksum All Files on a Difference Mirror option to ensure proper file comparisons. If you are not using database applications, disabling this option will shorten mirror times. |
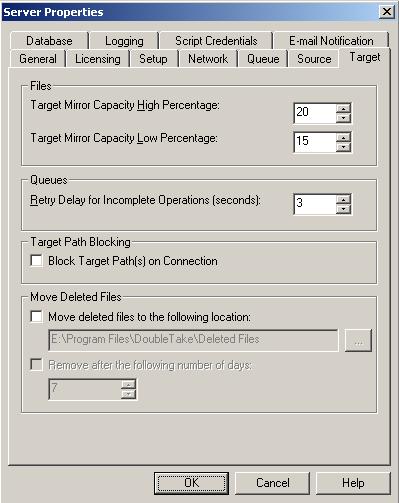
| Note: |
If you are going to use failover, any target paths that are blocked will automatically be unblocked during the failover process so that users can modify data on the target after failover. During a restoration, the paths are automatically blocked again. If you failover and failback without performing a restoration, the target paths will remain unblocked. You can manually block or unblock the target paths by right-clicking on a connection. Do not block your target paths if you are protecting a full-server workload because system state data will not be able to be written to the target. |
| Note: |
If deleted files are moved for long enough, the potential exists for the target to run out of space. In that case, you can manually delete files from the target move location to free space. If you have Ignore Delete Operations enabled on the source, the Move deleted files setting will never be invoked because there will be no delete operations performed on the target. Do not include the Recycler directory in your replication set if you are moving deleted files. If the Recycler directory is included, Double-Take Availability will see an incoming file deletion as a move operation to the Recycle Bin and the file will not be moved as indicated in the Move deleted files setting. Alternate data streams that are deleted on the source will not be moved on the target. Encrypted files that are deleted on the source will only be moved on the target if the move location is on the same volume as the replication set target path. Compressed and sparse files that are deleted on the source will be moved on the target, although the compression and sparse flags will only be retained on the target if the move location is on the same volume as the replication set target path. |
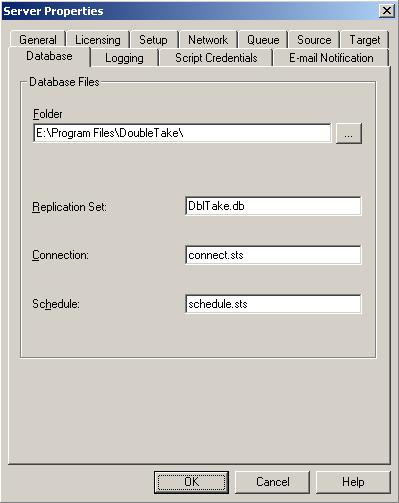
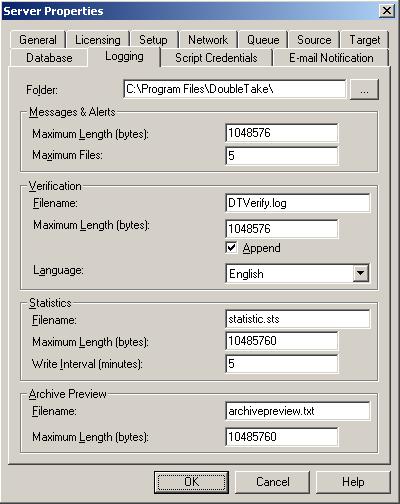
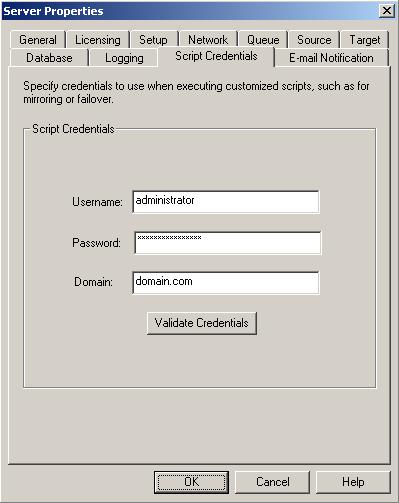
You can e-mail Double-Take Availability event messages to specific addresses. The subject of the e-mail will contain an optional prefix, the server name where the message was logged, the message ID, and the severity level (information, warning, or error). The text of the message will be displayed in the body of the e-mail message.
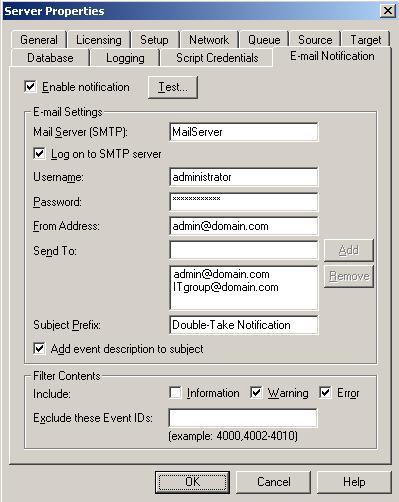
| Note: | Any specified notification settings are retained when Enable notification is disabled. |
If desired, enter unique text for the Subject Prefix which will be inserted at the front of the subject line for each Double-Take Availability e-mail message. This will help distinguish Double-Take Availability messages from other messages. This field is optional.
If desired, enable Add event description to subject to have the description of the message appended to the end of the subject line. This field is optional.
| Note: |
You can test e-mail notification by specifying the options on the E-mail Notification tab and clicking Test. (By default, the test will be run from the machine where the Replication Console is running.) If desired, you can send the test message to a different e-mail address by selecting Send To and entering a comma or semicolon separated list of addresses. Modify the message text up to 1024 characters, if necessary. Click Send to test the e-mail notification. The results will be displayed in a message box. Click OK to close the message and click Close to return to the E-mail Notification tab. E-mail notification will not function properly if the Event logs are full. If an error occurs while sending an e-mail, a message will be generated. This message will not trigger an e-mail. Subsequent e-mail errors will not generate additional messages. When an e-mail is sent successfully, a message will then be generated. If another e-mail fails, one message will again be generated. This is a cyclical process where one message will be generated for each group of failed e-mail messages, one for each group of successful e-mail messages, one for the next group of failed messages, and so on. If you start and then immediately stop the Double-Take service, you may not get e-mail notifications for the log entries that occur during startup. By default, most virus scan software blocks unknown processes from sending traffic on port 25. You need to modify the blocking rule so that Double-Take Availability e-mail messages are not blocked. |
Before you can protect your entire source, you need to select a target that is suitable to become the source, in the event of a source failure. Double-Take Availability will validate the target you select and identify any incompatibilities. Errors will disqualify the target as a suitable server. First you will need to find a compatible target, then you can establish full-server protection.
Review the table below to determine if your server is a compatible target.
| Requirement | Configuration |
|---|---|
| Operating system version | The source and the target must have the same operating system. For example, you cannot have Windows 2003 on the source and Windows 2008 on the target. The two servers do not have to have the same level of service pack or hotfix. |
| Domain | The domain of the source should be the same as the domain of the target. |
| Server role |
The target cannot be a domain controller. Ideally, the target should not host any functionality (file server, application server, and so on) because the functionality will be removed when failover occurs. If your source is a domain controller, it will start in a non-authoritative restore mode after failover. This means that if the source was communicating with other domain controllers before failover, it will require one of those domain controllers to be reachable after failover so it can request updates. If this communication is not available, the domain controller will not function after failover. If the source is the only domain controller, this is not an issue. |
| Architecture | The source and the target must have the same architecture. For example, you cannot failover a 32-bit server to a 64-bit server. |
| Processors | There are no limits on the number or speed of the processors, but the source and the target should have at least the same number of processors. If the target has fewer processors or slower speeds than the source, there will be performance impacts for the users after failover. |
| Memory | The target memory should be within 25% (plus or minus) of the source. If the target has much less memory than the source, there will be performance impacts for the users after failover. |
| Network adapters | You must map at least one NIC from the source to one NIC on the target. If the source has more NICs than the target, some of the source NICs will not be mapped to the target. Therefore, the IP addresses associated with those NICs will not be available after failover, unless you configure the advanced options. If there are more NICs on the target than the source, the additional NICs will still be available after failover. |
| File system format | The source and the target must have the same file system format. For example, an NTFS volume cannot be sent to a FAT volume. |
| HAL type and version | The Windows hardware abstraction layer (HAL) refers to a layer of software that deals directly with your computer hardware. The HAL type and version do not have to be identical, but they must be compatible between the source and the target. If the two are incompatible, Double-Take Availability will warn you. In that case, you must upgrade or downgrade the target. |
| Administrative shares | The Full-Server Failover Manager console must be able to access administrative shares on the source and the target. |
| Boot volume configuration | The target boot volume cannot be a dynamic disk configuration. The boot volume is the disk volume that contains the Windows operating system and supporting files. By default, the operating system files are in the \Windows folder, and the supporting files are in the \Windows\System32 folder. The boot volume might be the same volume as the system volume, but that configuration is not required. |
| System volume | The target must have the same system volume as the source. The system volume is the disk volume that contains the hardware-specific files that are needed to start Windows. The system volume might be the same volume as the boot volume, but that configuration is not required. |
| Logical volumes | There are no limits to the number of logical volumes, although you are bound by operating system limits. The source and the target must have the same number of logical volumes, and the source and the target must have the same drive letters. For example, if the source has drives C: and D:, the target cannot have drives D: and E:. In this case, the target must also have drives C: and D:. |
| System path | The source and the target must have the same system path. The system path includes the location of the Windows files, Program Files, and Documents and Settings. |
| Double-Take Availability path | Double-Take Availability must be installed on the system path on the source and the target. |
| Double-Take Availability data state | The source should be from a time when the Double-Take Availability data state is good. If you are using snapshots, you may want to use a snapshot from the last good data state. |
| Capacity and free space |
The target must have enough space to store the data from the source. This amount of disk space will depend on the applications and data files you are protecting. The more data you are protecting, the more disk space you will need. You must also have enough space on the target to process and apply the system state data. Double-Take Availability performs several validation checks to determine if adequate disk space is available. First, the target must have enough free space on its system volume to hold the entire volume(s) (free and used) from the source. If this first validation check passes, then no additional checks are necessary. Otherwise, there must be at least enough free space on the target system volume to store the system path (including the location of the Windows files, Program Files, and Documents and Settings) from the source. If this second validation check passes, then no additional checks are necessary. If this second validation fails, Double-Take Availability will check to see if a previous failover may have been attempted. Since Double-Take Availability can reuse the disk space from a previous failover attempt, it will add the size of that data to the amount of free space available. If that is enough space for the failover, the failover will continue. If not, you will either have to select a different target or delete files on the target to free disk space. |
Use the following instructions to establish protection for your entire source.
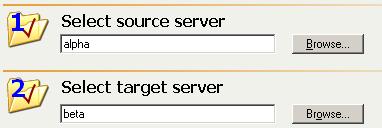
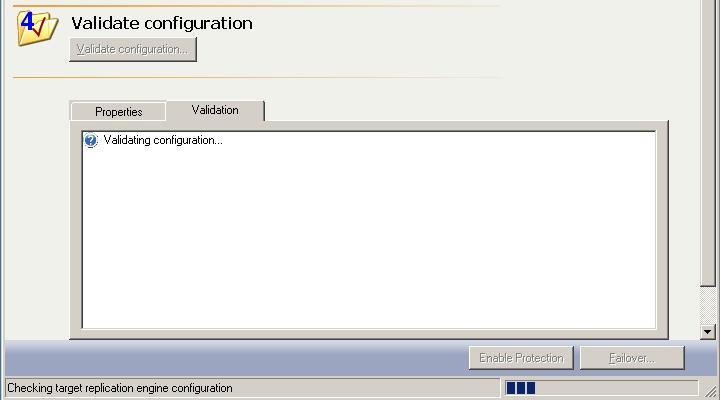
| Note: |
After protection is enabled, a View Configuration link will display the optional protection settings in read-only mode. If you need to modify any of the optional protection settings, you will have to disable your protection, modify the optional protection settings, and then re-enable protection. If you have a full-server protection connection established, do not create any other Double-Take Availability connections from or to the source or target. If you are using a cluster, you must manually alter the disk signature before or after failover. See the Microsoft Knowledge Base article 280425 for details on how to change the disk signature. You can automate the disk signature alteration as part of failover using the pre- or post-failover scripts. |
Optional protection settings are available when configuring a full-server protection connection, but they are not required. If you want to configure the optional settings, make sure you have a valid source and target specified, then click Configure protection from the main Full-Server Failover Manager page.
You have the following optional configuration settings available.
| Note: | Together, the Monitor interval and Missed intervals settings determine the total time before failover would be triggered. For example, five missed checks every five seconds would be 25 seconds to trigger failover. To achieve shorter delays before failover, use lower values. To achieve longer delays before failover, choose higher values. |
| Note: |
If you are protecting a cluster node and select Retain target network configuration, the virtual IP addresses associated with the cluster will still be failed over. The only IP address that will not be failed over is the physical IP address of the cluster node. |
If your source and target are on opposite sides of a NAT or firewall, you will need to configure your hardware to accommodate full-server workload communications. You must have the hardware already in place and know how to configure the hardware ports. If you do not, see the reference manual for your hardware.
By default, Double-Take Availability uses port 6320 for all communications. To verify or modify the ports, you must use the Replication Console.
Double-Take Availability uses ICMP pings to monitor the source for failover. A failover monitor will not be created if ICMP is blocked (although the data and system state will still be protected). You should configure your hardware to allow ICMP pings between the source and target. If you cannot, you will have to monitor for a failure using the Double-Take Availability replication service. Use the Monitor Type option on the configuration Failover tab to set your failover monitoring method.
Full-server workload protection uses WMI (Windows Management Instrumentation) which uses RPC (Remote Procedure Call). By default, RPC will use ports at random above 1024, and these ports must be open on your firewall. RPC ports can be configured to a specific range by specific registry changes and a reboot. See the Microsoft Knowledge Base article 154596 for instructions.
Full-server workload protections also rely on other Microsoft Windows ports.
These ports must be open on your firewall. Check your Microsoft documentation if you need to modify these ports.
You need to configure your hardware so that the full-server ports and Microsoft Windows ports are open. Since communication occurs bidirectionally, make sure you configure both incoming and outgoing traffic.
There are many types of hardware on the market, and each can be configured differently. See your hardware reference manual for instructions on setting up your particular router.
Protecting an application consists of three main tasks - configuring the protection, validating the protection, and enabling the protection. The processes are similar for the different application types, however, there are some variances. Optional protection settings are available when configuring application protection, but they are not required.
| Note: | The fields in the Application Manager console will vary depending on the type of application you are protecting. |
Application Manager will automatically identify the root domain where the Application Manager is running and populate the Domain Name field. If necessary, change the domain name to a trusted root domain that the Application Manager console can connect to. If prompted, enter security credentials with administrator privileges for the domain.
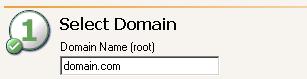
| Note: |
Domain names must include a suffix, such as .com, .corp, .net, and so on. If you are protecting Exchange, the domain must be the root of the forest domain because that is where all Exchange server objects reside, even if the Exchange server is a member of a child domain. |
Application Manager will automatically attempt to populate the Source Server and Target Server lists with any servers in the specified domain that are running the application you are protecting. Select your source and target servers.
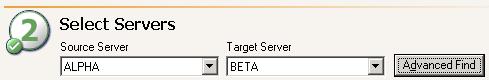
| Note: |
If you have previously used this source and target pair, you will be prompted to reuse the previous configuration. If you select Yes, your previous configuration settings will be used. If you do not want to use the previous configuration settings (perhaps the source or target configuration has changed since you configured the connection), select No to use the default configuration settings. If you select a source that is currently unavailable, you will be prompted to select the target first. When you select the target then the source, you may get a failover prompt or the same source is unavailable prompt. This will depend on if a failover condition has been met according to the original failover configuration. You cannot protect a server if it is already functioning as a target. If you are using a cluster environment, select your virtual server as you would a physical server. If you are protecting Exchange, the target you select must be in the same Exchange administrative group as the source. If you are protecting Exchange in a like-named cluster scenario, select the same server for the source and target. The target server name will automatically be appended with the suffix like-named. Enter the requested information in the Like-named Cluster Setup dialog box.
If you have protecting multiple Exchange virtual servers, you can configure multiple like-named cluster protection connections, or you can failover multiple Exchange virtual servers to pre-existing Exchange virtual servers on the target. In this case, select the target Exchange virtual server. If you are protecting Exchange 2003 and it is running in mixed mode, the first installed Exchange virtual server contains the MTA (Message Transfer Agent) resource that is needed to communicate with versions prior to Exchange 2003. If you do not failover all Exchange virtual servers, then any user who is in a different mail store than the first one may not be able to route mail. If you are protecting SharePoint, enter the SharePoint Front-End Web Server and click Get Config to populate the Source Server list. If no servers are populated in the lists (perhaps the server you need is in a child domain), click Advanced Find to add servers to the lists. Advanced Find is not available for all application protections. See Managing servers for more details on Advanced Find. Server names must be 15 characters or less. You will be unable to configure protection when your environment between the Application Manager and the source or target contains a NAT or certain VPN configurations. This is due to WMI limitations. Contact technical support for instructions to configure protection manually. |
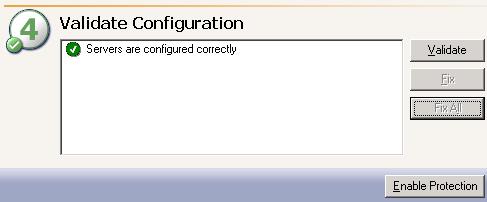
| Note: |
If you are using DNS failover and did not enter DNS credentials under the optional protection settings, you will be prompted for credentials that can access and modify DNS records. If you validate a source and target pair that is already in a Protected state and the validation detects issues with the target, Fix and Fix All will be disabled. You must disable the protection, fix the issue, then re-enable protection. If you are protecting SQL, are using Database Only mode, and the database is online on the target, the database cannot be taken offline on the target by using Fix if it has a SQL Server replication publication. The publication will have to be deleted using the SQL Server management tools before the database can be taken offline. For SQL 2000 servers, Application Manager may hang when rerunning validation after disabling protection in the same session. To work around this issue, disable the protection, stop and restart the Application Manager, then validate or enable protection. |
| Note: |
If you are protecting Exchange keep in the mind the following caveats.
If you are protecting Exchange or SQL on a cluster, if the target cluster has more than one IP address resource for the virtual Exchange or SQL Server you may experience the following issue. If the one of the IP addresses is not routable from the source server and that IP address was created before any of the routable IP address resources, the Application Manager will fail to enable protection. To enable protection, you will need to delete the non-routable IP address resource(s), re-create them, and then re-add them as dependencies on the network name resource for the virtual server. If you modify your source server configuration on the source server, for example, adding a new storage group or database, you must disable protection, run validation and fix any issues, then re-enable protection to apply the changes. If your application protection is in a cluster environment, you should not move any resources from one cluster group to another once protection is established. If you close Application Manager prior to enabling protection, your configuration changes will not be saved. You must enable protection in order to save your configuration settings. After you have enabled protection, do not use the Failover Control Center client to edit your failover configuration. Doing so will force a failover. If this occurs, cancel the failover prompt and then disable and re-enable monitoring using Application Manager. |
Optional protection settings are available when configuring application protection, but they are not required. If you want to configure the optional settings, make sure you have a valid domain and servers specified, then click Configure from the main Application Manager page.
You have the following optional configuration settings available.
| Note: | The fields on the Failover tab will vary depending on the type of application you are protecting. |
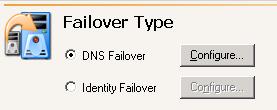
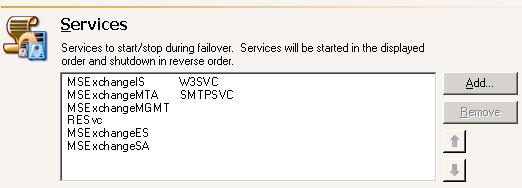
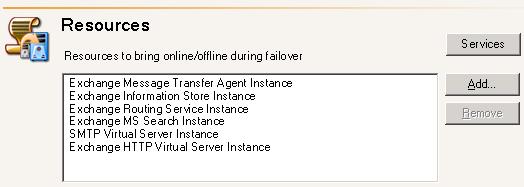
Application Manager will automatically determine default DNS failover settings. Use the following instructions to modify the DNS failover settings.
| Note: |
If you want to set the primary DNS server that Double-Take Availability will use during failover, you can specify Client DNS Server. This option is only available if you have launch the Application Manager using the command line advanced option. |
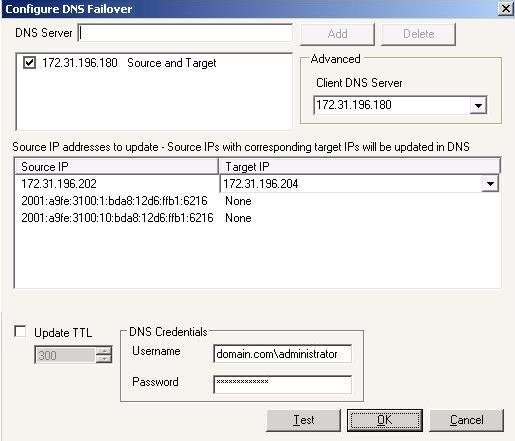
| Note: | If you are protecting Exchange and one or more IP addresses are configured for the SMTP virtual server on the target, the first IP address will be the default target IP address for all source IP addresses. |
| Note: |
In order to update the Time to Live, the machine where the Application Manager is running must be able to connect to the DNS server through WMI. If it cannot, the Time to Live record will not be updated and the Application Manager will return an error that the RPC server is unavailable. |
Application Manager will automatically determine default identity failover settings. Use the following instructions to modify the identity failover settings.
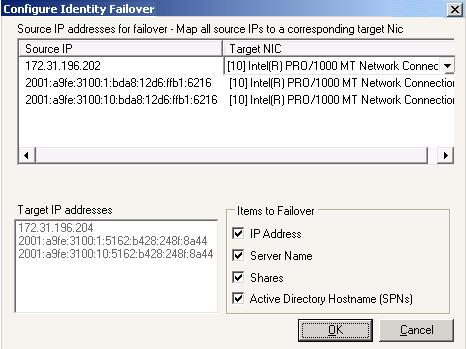
| Note: |
If your source and target are on different subnets, you should not failover the IP address. If you are protecting Exchange, do not failover the Active Directory host name. If you are protecting SQL, do not failover the server name. You cannot failover file shares from a parent to child domain. |
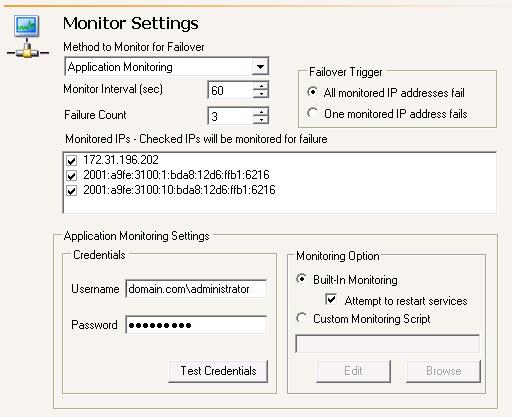
| Note: |
To achieve shorter delays before failover, use lower Monitor Interval and Failure Count values. This may be necessary for IP addresses on servers that must remain available and responsive at all times. Lower values should be used where redundant interfaces and high-speed, reliable network links are available to prevent the false detection of failure. If the hardware does not support reliable communications, lower values can lead to premature failover. To achieve longer delays before failover, choose higher values. This may be necessary for IP addresses on slower networks or on a server that is not transaction critical. For example, failover would not be necessary in the case of a server restart. Additionally, in a cluster environment, you must take into account the time it will take for a virtual server to failover between nodes. |
| Note: |
A sample Visual Basic script for application monitoring is available in the \Application Manager\Samples subdirectory where Double-Take Availability is installed. If you are using a PowerShell script, PowerShell must be installed on the target. |
| Note: | Snapshots are not available in cluster environments. |
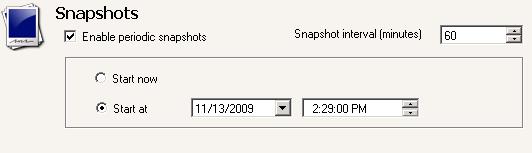
You can configure routing and mirroring settings for your application connection. In addition, there are application specific settings that you can configure. The fields on the Connection tab will vary depending on the type of application you are protecting.
| Note: | The fields on the Connection tab will vary depending on the type of application you are protecting. |
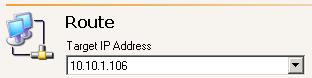
Application specific protection options are available on the Configure Protection Connection tab. The fields on the Connection tab will vary depending on the type of application you are protecting.
If you are protecting Exchange, you can specify which storage groups, mailboxes, and public folder stores that you want to protect.
| Note: | The fields on the Connection tab will vary depending on the type of application you are protecting. |
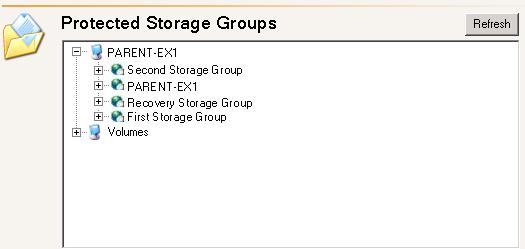
| Note: |
If you do not select all storage groups, you should make sure that other backups are available. Ideally, you should place all query-based distribution groups in a single organization container and give the target server full control to the container and all child objects. Names with a plus sign (+) are not supported. You must rename the storage group and remove the plus sign. The Protected Storage Groups list will be disabled if you have enabled Override Generated Rules on the Advanced tab. |
If you are protecting SQL, you can protect the SQL instance or only the database only.
| Note: | The fields on the Connection tab will vary depending on the type of application you are protecting. |
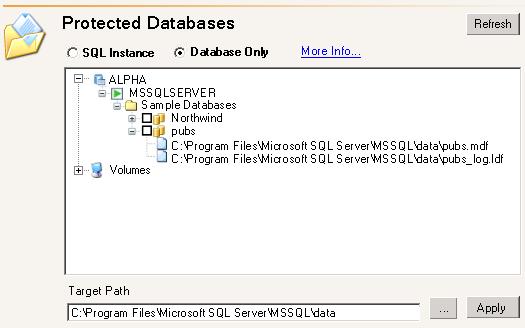
With this option, the source and target servers must have the following configuration.
If your two SQL servers have unique instances installed, you can protect databases from both servers if the target has at least those two instances installed.
Keep in mind, if the database names (accounting1.mdf and accounting2.mdf) or locations on the target (\source1\accounting1\accounting.mdf and \source2\accounting2\accounting.mdf) are unique, you can protect and failover both databases to the same target.
If you are protecting a file server, you can specify the file shares that you want to protect.
| Note: | The fields on the Connection tab will vary depending on the type of application you are protecting. |
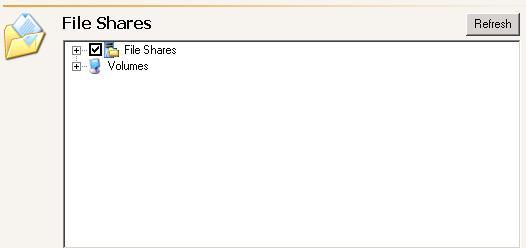
| Note: |
The File Shares list will be disabled if you have enabled Override Generated Rules on the Advanced tab. If your source is a domain controller, you cannot protect the NETLOGON and SYSVOL shares and they will not be visible in the File Shares tree. |
| Note: | The fields on the Connection tab will vary depending on the type of application you are protecting. |
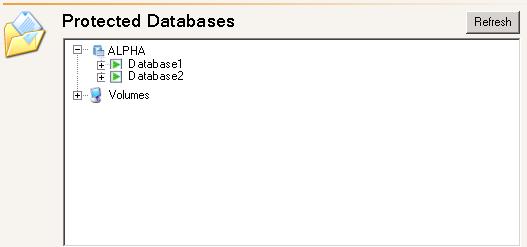
| Note: |
You cannot deselect the databases containing the BES or MDS information. If you do not want to protect the MDS database, deselect Protect MDS services on the BlackBerry tab using the instructions below. You may want to exlude the tempdb database to reduce mirroring and replication traffic. The Protected Databases list will be disabled if you have enabled Override Generated Rules on the Advanced tab. |
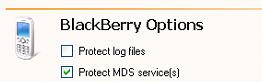
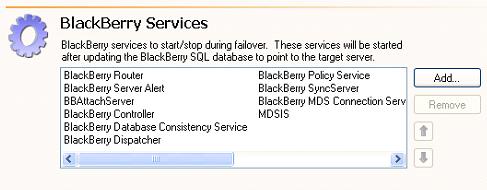
| Note: | The fields on the Connection tab will vary depending on the type of application you are protecting. |
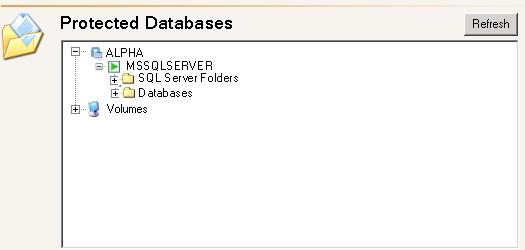
| Note: |
The servers must have the same version of SharePoint (major and minor versions). The servers must have the same logical drive structure where the SharePoint program and data files are stored. If you are using a SQL server named instance for a back-end database server in your SharePoint setup, both the source and target SQL servers must have the same named instances and the same logical drive structure. You may want to exlude the tempdb database to reduce mirroring and replication traffic. The Protected Databases list will be disabled if you have enabled Override Generated Rules on the Advanced tab. |
| Note: |
The target web server must have the same version of SharePoint installed as the product SharePoint web server. For best results, SharePoint should be installed but not yet configured on the target web server. In order to extend the target web server, you will need to add the SharePoint administrator account to the local domain administrator group on the target server before you extend target web front-end server into the farm. |
| Note: | You must manually install the Central Administration web application after the target has been extended in order to be able to administer SharePoint in the event of a failover. |
| Note: | The fields on the Connection tab will vary depending on the type of application you are protecting. |
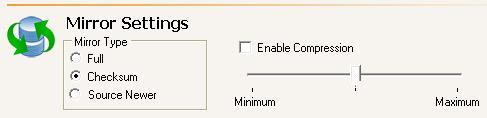
You can configure advanced settings for you application connection. The advanced settings that are available will depend on the application you are protecting. Therefore, the fields on the Advanced tab will vary. In addition, the fields will vary depending on if you launched Application Manager in standard or advanced mode.
Application Manager automatically creates a replication set with a name based on the application you are protecting. The list below contains the default replication set names, where source and target are the names of the respective servers.
Application Manager selects all of the necessary directories and files to add to your replication set to protect your application. You should only modify the replication set definition if there are additional directories or files that you want to protect. Do not modify the rules unless you are familiar with Double-Take Availability and your application.
| Note: |
If you are protecting Exchange and want to protect the Badmail folder, you will need to manually add it using the instructions below. If you are protecting SQL, the folder that contains a database’s FILESTREAM data will automatically be included in the replication set for protection if the database is included for protection. Any steps previously taken to enable FILESTREAM support on the source (for instance, file system or operating system-level changes that were made specifically to support FILESTREAM) must also be applied similarly to the target for consistency. Failure to account for FILESTREAM-specific changes on the target server, or specifically excluding FILESTREAM data files/paths from the replication set, can impact SQL Server’s ability to mount a database with FILESTREAM data when failing over. |
| Note: | The fields on the Advanced tab will vary depending on the type of application you are protecting. In addition, the fields will vary depending on if you launched Application Manager in standard or advanced mode. |
Scripts are executed at different points during failover, failback, and restoration. The scripts perform actions to make your applications available on the appropriate server. Editing scripts is an advanced feature. Do not modify the scripts unless you are familiar with Double-Take Availability, your application, and scripting. Any edits should be made carefully and tested prior to deployment to ensure the changes are correct. Incorrect script changes could cause failover issues.
| Note: | The fields on the Advanced tab will vary depending on the type of application you are protecting. In addition, the fields will vary depending on if you launched Application Manager in standard or advanced mode. |
Any changes you save to the scripts will be copied to the appropriate server when the configuration changes are accepted. If you reconfigure your application protection after making script changes, Application Manager will copy updated scripts to the appropriate server, overwriting any changes that you manually made. You should make a backup copy of your script changes to copy over after making Application Manager updates. If you want to make the script changes permanent, you must modify the script files manually in the Double-Take Availability installation location.
If you are protecting Exchange, you can configure several settings for Active Directory.
| Note: | The fields on the Advanced tab will vary depending on the type of application you are protecting. In addition, the fields will vary depending on if you launched Application Manager in standard or advanced mode. |
| Note: |
If you want to add the target back to the PF list to which the source belongs, you will need to enable the Restore PF Tree option.
This setting is cleared when protection is enabled, which prevents SMTP queuing issues when trying to deliver messages to the target, but is never restored. If you want to have an active target server, you can use this command to restore it to an Application Manager state. |
If you are performing an identity failover, then you have already selected the Items to Failover. Changing any of the Items to Failover on the Advanced tab will automatically make the same change on the Failover tab Configure Identity Failover page. However, if you are performing DNS failover, you may want to modify the items that you are failing over using the instructions below.
| Note: | The fields on the Advanced tab will vary depending on the type of application you are protecting. In addition, the fields will vary depending on if you launched Application Manager in standard or advanced mode. |
| Note: |
If your source and target are on different subnets, you should not failover the IP address. If you are protecting Exchange, do not failover the Active Directory host name. If you are protecting SQL, do not failover the server name. You cannot failover file shares from a parent to child domain. |
Several default connection options are available which allow you to disable or enable the creation of default connection parameters. Ideally, you want Application Manager to create the default parameters. However, if you have modified any of the parameters manually and you do not want your modifications overwritten by the defaults, then you may want to disable the creation of the default connection parameters.
| Note: | The fields on the Advanced tab will vary depending on the type of application you are protecting. In addition, the fields will vary depending on if you launched Application Manager in standard or advanced mode. |
If your source and target are on opposite sides of a NAT or firewall, you will need to configure your hardware to accommodate application workload communications. You must have the hardware already in place and know how to configure the hardware ports. If you do not, see the reference manual for your hardware.
By default, Double-Take Availability uses port 6320 for all communications. To verify or modify the ports, use the following instructions.
Double-Take Availability uses ICMP pings to monitor the source for failover. A failover monitor will not be created if ICMP is blocked (although the data and application will still be protected). You should configure your hardware to allow ICMP pings between the source and target. If you cannot, you will have to monitor for a failure using the Double-Take Availability replication service. Use the Method to Monitor for Failover option on the configuration Monitoring tab to set your failover monitoring method.
| Note: | If you are protecting SharePoint, you also need to configure your hardware to allow communication on port 6350. |
Application workload protection uses WMI (Windows Management Instrumentation) which uses RPC (Remote Procedure Call). By default, RPC will use ports at random above 1024, and these ports must be open on your firewall. RPC ports can be configured to a specific range by specific registry changes and a reboot. See the Microsoft Knowledge Base article 154596 for instructions.
Application workload protections also rely on other Microsoft Windows ports.
These ports must be open on your firewall. Check your Microsoft documentation if you need to modify these ports.
You need to configure your hardware so that the application workload ports and Microsoft Windows ports are open. Since communication occurs bidirectionally, make sure you configure both incoming and outgoing traffic.
There are many types of hardware on the market, and each can be configured differently. See your hardware reference manual for instructions on setting up your particular router.
When you configure Exchange for protection, Application Manager creates customized scripts based on the settings you choose. The scripts are based on the Exchange Failover Utility (EFO). Generally, you do not need to run the Exchange Failover Utility from the command line or modify the scripts that Application Manager creates, however, the syntax for the utility is provided below in case that need arises.
| Command | EFO |
| Description | Used in script files to failover Exchange data |
| Syntax |
EXCHFAILOVER -FAILOVER | -FAILBACK -S <source> -T <target> [-L <filename>] [-NORUS] [-NORM] [-NOSPN] [-NOOAB] [-NOADREPLICATION] [-MAXREPWAIT <minutes>] [-NOEXCHANGEAB] [-NOQUERYBASEDDISTGROUPS] [-NORGCONNECTORS] [-NOPUBLICFOLDERS] [-ONLYPUBLICFOLDERS] [-MOVEHOSTSPN] [-O <filename>] [-R [<source_group>] [,<source_mailstore>] [: [<target_group>] [,<target_mailstore>] ] ] [-SETUP] [-TEST] [-U <name> : <password>] [-VIRTUAL <new_IPaddress>] [-DC <domain_name> | <IPaddress>] [-SDOMAIN] [-TDOMAIN] [/?] [/??] |
| Options |
|
| Examples |
|
Select a link from the table below for protection instructions that correspond with your virtual configuration.
| If your source is... | and you want to protect... | and your target is... | then see these instructions... |
|---|---|---|---|
| a physical or virtual server | the volumes from the physical server or the volumes from within the virtual guest operating system | a virtual server on a Hyper- V server | Protecting an entire physical or virtual server to a Hyper-V or ESX server |
| a virtual server on an ESX server | |||
| a virtual server on a Hyper-V server | the host-level virtual disk files (.vhd and .vmdk files) | a virtual server on a Hyper-V server | Protecting a Hyper-V server to a Hyper-V server |
| a virtual server on an ESX server | a virtual server on an ESX server | Protecting an ESX server to an ESX server |
Use these instructions to protect a physical or virtual server, where you want to protect the volumes from the physical server or the volumes from within the virtual guest operating system, to a virtual server on a Hyper-V or ESX server.
Specify the source server that you want to protect. This is the physical or virtual server that you want to protect.
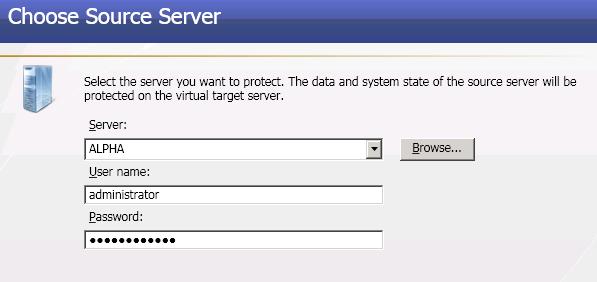
| Note: |
If you enter the source server's fully-qualified domain name, the Double-Take Console will resolve the entry to the server short name. If that short name resides in two different domains, this could result in name resolution issues. In this case, enter the IP address of the server. Your source can have no more than four NICs enabled, except if your source is ESX version 4.x. In that case, you can have up to ten NICs. |
Choose the volumes on the source server that you want to protect.
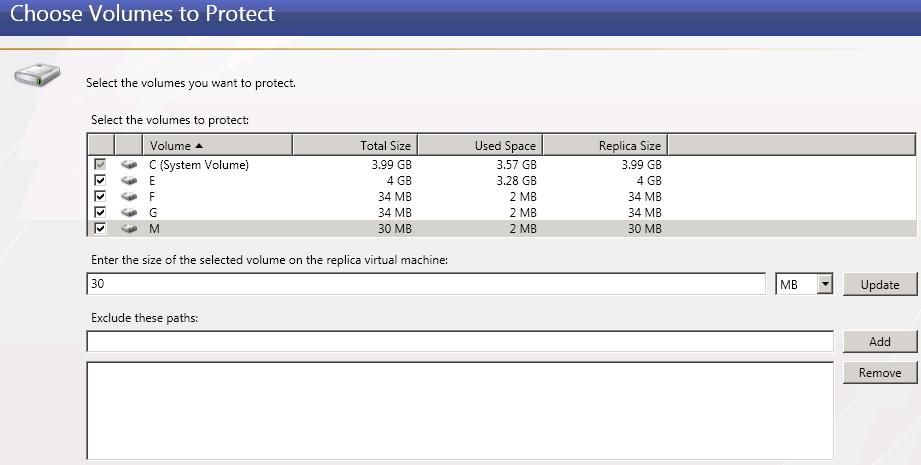
| Note: | If the size of the replica virtual machine is identical to the size of the source volume and the source has less than 20 MB of free disk space remaining, you may run out of disk space on the replica due to differences in how the virtual disk's block size is formatted. To avoid this issue, specify the size of your replica virtual machine to be at least 20 MB larger. |
Specify the target server. If you are protecting to a Hyper-V server, this is the name of the Hyper-V server. If you are protecting to a ESX server, this is the host name of your virtual recovery appliance.
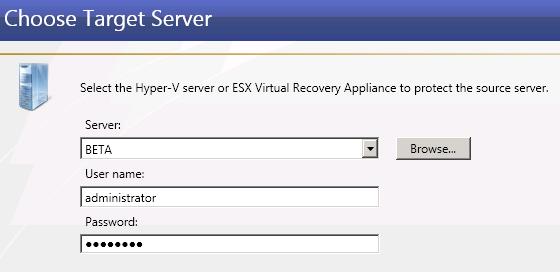
| Note: |
If you enter the target server's fully-qualified domain name, the Double-Take Console will resolve the entry to the server short name. If that short name resides in two different domains, this could result in name resolution issues. In this case, enter the IP address of the server. |
If you are protecting to an ESX server, specify the ESX server information for your target virtual recovery appliance.
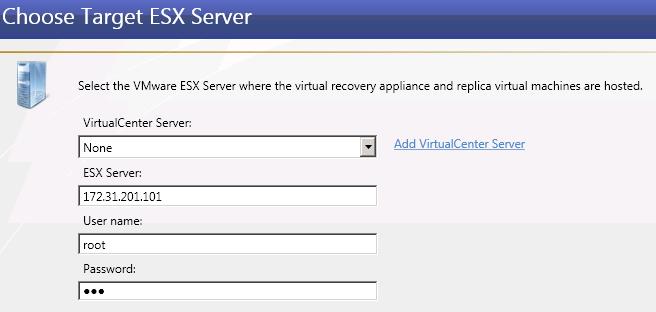
If you are using a Hyper-V target, select a location on the target for the replica virtual machine.
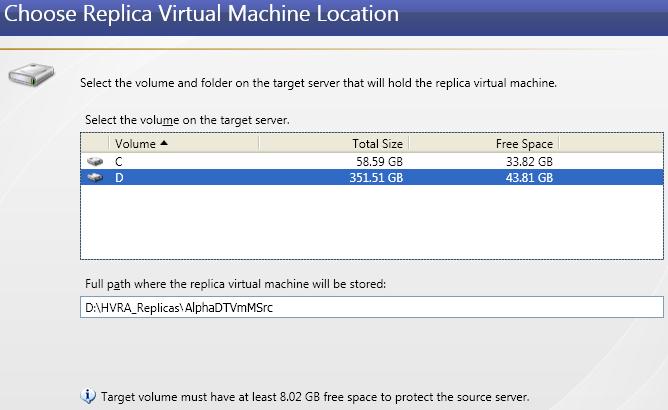
If you are using an ESX target, select a location on the target for the replica virtual machine.
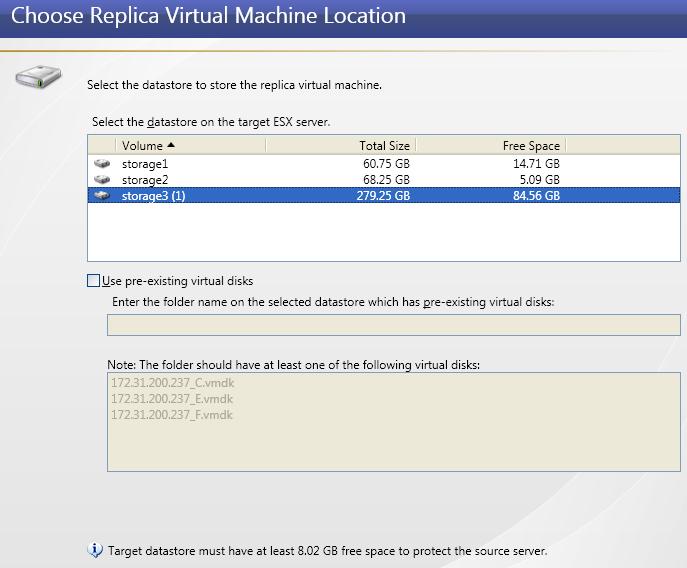
Use pre-existing virtual disks—You can reuse an existing virtual disk on your ESX target, rather than having Double-Take Availabilitycreate a virtual disk for you. This saves time by skipping the virtual disk creation steps and performing a difference mirror instead of a full mirror. In order to use a pre-existing virtual disk, it must be a valid VMware virtual disk. It cannot be attached to any other virtual machine, and the virtual disk size cannot be changed.
Because Double-Take Availability will skip the virtual disk creation steps when using a pre-existing disk, Double-Take Availability will instead copy your existing virtual disk to the default VMware new virtual machine location. Therefore, it is important that you do not place your existing virtual disk in the new folder location that VMware will create. Put the pre-existing virtual disk in a temporary location on the target. Specify this temporary location for Enter the folder name on the selected datastore which has pre-existing virtual disks.
In order for Double-Take Availability to find the pre-existing disk, the virtual disk file names must be formatted using the convention SourceServer_DriveLetter. For example, if your source server is Alpha and you are protecting drives C and D, Double-Take Availability will look for the file names Alpha_C.vmdk and Alpha_D.vmdk. If you are using IP addresses, substitute the IP address for the server name. For example, if the IP address for server Alpha is 172.31.10.25 then Double-Take Availability will look for the file names 172.31.10.25_C.vmdk and 172.31.10.25_D.vmdk.
If you originally created a virtual disk and specified the source server by its IP address, the pre-existing virtual disk file name cannot use the server name. However, you can rename that file and its associated -flat.vmdk file to use the IP address. The reverse is also true. If you originally specified the source server by its name, the pre-existing virtual disk file name cannot use the server’s IP address. However, you can rename the file and its associated -flat.vmdk to use the source name. For example, if you originally created a virtual disk and specified the source by its IP address, you need to rename the file source_name_drive.vmdk to source_IPaddress_drive.vmdk. You also need to rename the file source_name_drive-flat.vmdk to source_IPaddress_drive-flat.vmdk. The reverse (change source_IPaddress to source_name for both files) is also true. Additionally, you will need to edit the .vmdk file manually because it contains the name of the -flat.vmdk file. Modify the reference to the -flat.vmdk file to the new name you have specified using any standard text editor.
In a WAN environment, you may want to take advantage of the Use pre-existing virtual disks feature by using a process similar to the following.
Configure the replica virtual machine.
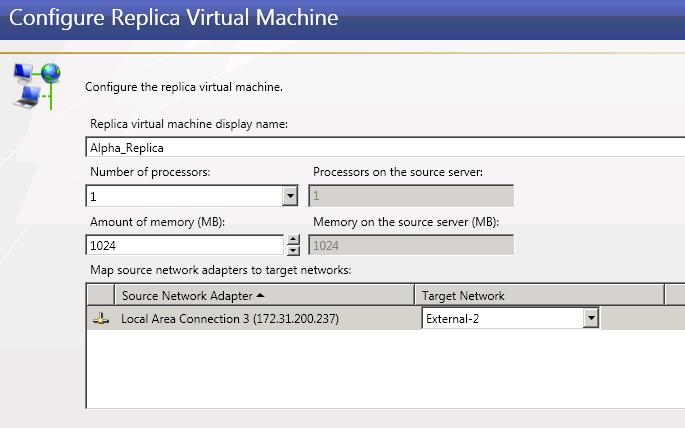
Specify your protection settings.
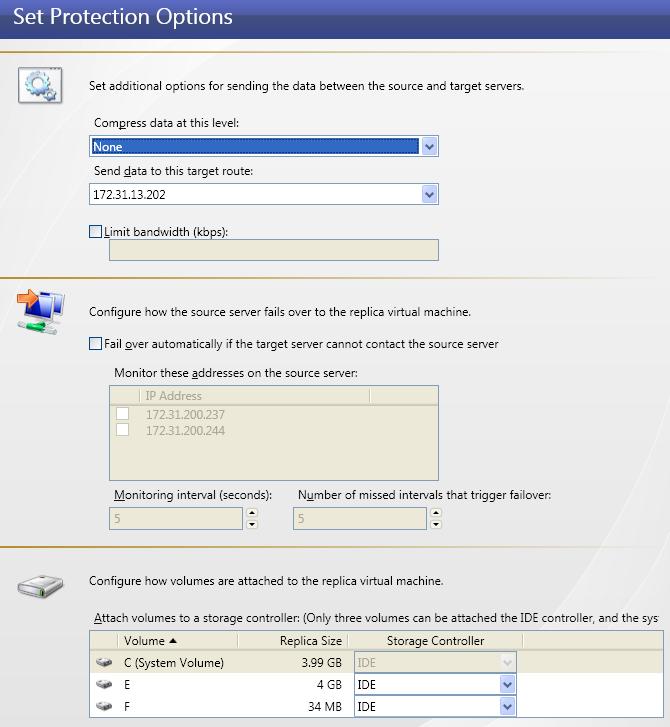
The fields on this screen will vary depending on if you are using an ESX target or a Hyper-V target.
| Note: | To achieve shorter delays before failover, use lower interval and missed interval values. This may be necessary for servers, such as a web server or order processing database, which must remain available and responsive at all times. Lower values should be used where redundant interfaces and high-speed, reliable network links are available to prevent the false detection of failure. If the hardware does not support reliable communications, lower values can lead to premature failover. To achieve longer delays before failover, choose higher values. This may be necessary for servers on slower networks or on a server that is not transaction critical. For example, failover would not be necessary in the case of a server restart. |
| Note: |
A maximum of three volumes can be attached to an IDE controller. If you are protecting more than three volumes on the source, you will need to install the Hyper-V Integration Components to acquire a SCSI device. See your Hyper-V documentation for more information. If your source is Windows 2003 or Windows 2008 with no service packs and you have selected a SCSI controller, you will need to manually install the Hyper-V Integration Components after failover to attach these volumes to the replica virtual machine. |
Use these instructions to protect a virtual machine on a Hyper-V server, where you want to protect the host-level virtual disk files (the .vhd files), to a virtual server on a Hyper-V server.
Specify your source server. This is the Hyper-V source that contains the virtual machine that you want to protect.
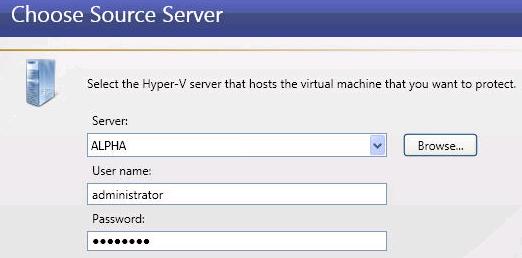
| Note: |
If you enter the source server's fully-qualified domain name, the Double-Take Console will resolve the entry to the server short name. If that short name resides in two different domains, this could result in name resolution issues. In this case, enter the IP address of the server. |
Choose the virtual machine on the Hyper-V source that you want to protect. Select a virtual machine from the list and click Next to continue.
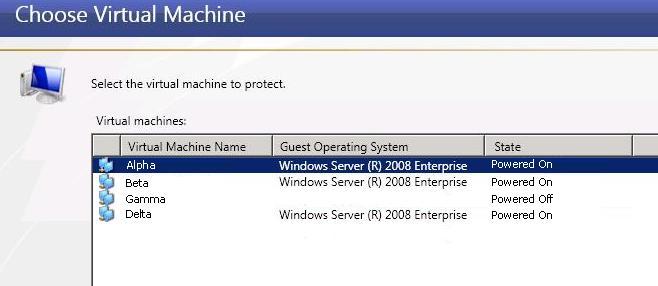
Specify the Hyper-V target server where you will store the replica of the source server.
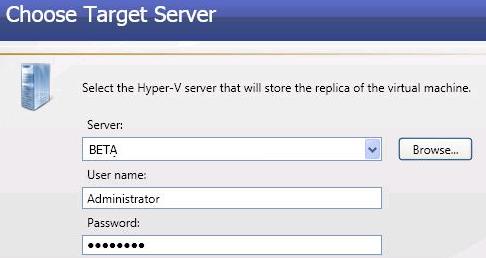
| Note: |
If you enter the target server's fully-qualified domain name, the Double-Take Console will resolve the entry to the server short name. If that short name resides in two different domains, this could result in name resolution issues. In this case, enter the IP address of the server. |
Select a home folder on the Hyper-V target for the replica virtual machine.
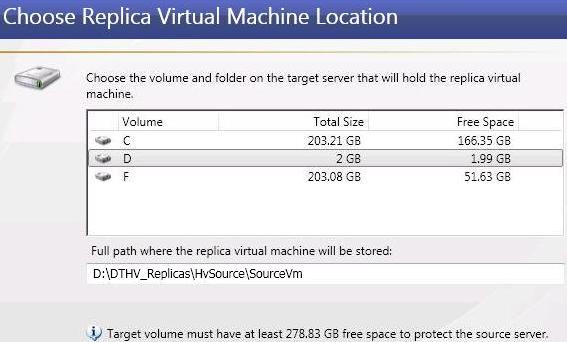
Configure the replica virtual machine.
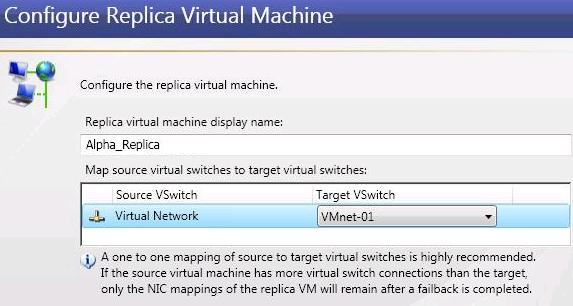
Specify your protection settings.
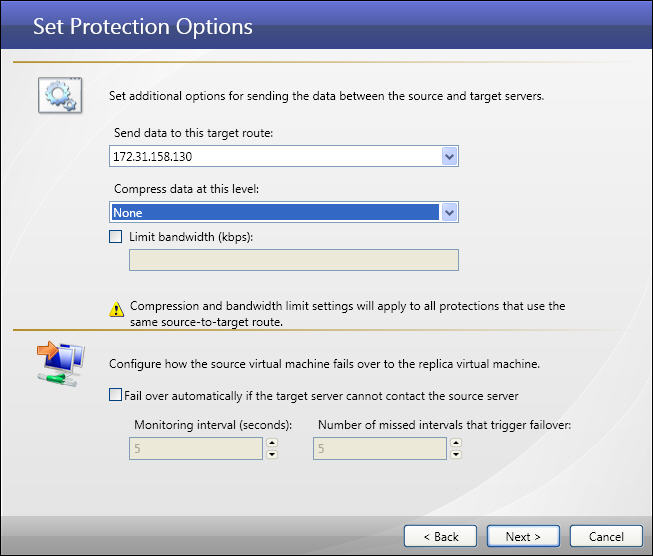
| Note: | To achieve shorter delays before failover, use lower interval and missed interval values. This may be necessary for servers, such as a web server or order processing database, which must remain available and responsive at all times. Lower values should be used where redundant interfaces and high-speed, reliable network links are available to prevent the false detection of failure. If the hardware does not support reliable communications, lower values can lead to premature failover. To achieve longer delays before failover, choose higher values. This may be necessary for servers on slower networks or on a server that is not transaction critical. For example, failover would not be necessary in the case of a server restart. |
| Note: |
Once protection is established, Double-Take Availability monitors the virtual disks of the protected virtual machine for changes to the disk layout. If a new virtual hard disk is added to the virtual machine, the protection job will automatically be updated to include the new virtual hard disk, and a file difference mirror will automatically start. However, if a virtual hard disk is removed from the protected virtual machine, the virtual hard disk will not be removed from the projection job until it is deleted from the source or the protection job is deleted and re-created. |
Use this process to protect a virtual machine on an ESX server, where you want to protect the host-level virtual disk files (the .vmdk files), to a virtual server on an ESX server. In this scenario, you have several steps to complete.
| Note: |
If the Double-Take Availability for VMware Infrastructureconsole and the Double-Take Availability for VMware Infrastructure service are on separate machines, the machines cannot be separate by a firewall because Microsoft .NET remoting is required, which is not compatible with a firewall configuration. |
You must configure both your source and target ESX servers to allow either root or non-root login. If you are not using VirtualCenter, you must use root account credentials. If you want to use non-root credentials, VirtualCenter is required. In addition to using non-root credentials, VirtualCenter allows you to use VMotion to move the virtual machine.
Add the following line to the configuration file.
username ALL=(ALL) NOPASSWD: ALL
Execute the following command to make sure you can access VMware datastores on /vmfs/volumes. If the command succeeds (prints the counts of the root home folder), then sudo is configured correctly. If it fails with a permission denied error or prompts for a password, then sudo is misconfigured.
sudo ls ~root
Select the virtual machine that you want to protect.
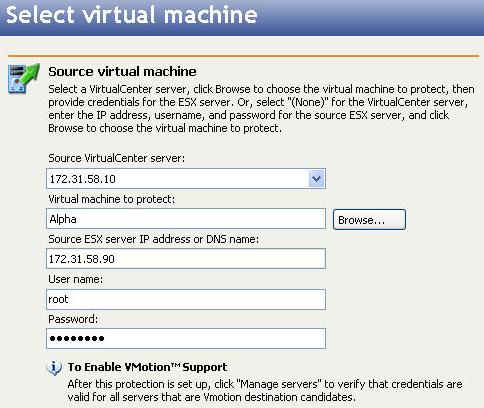
| Note: |
Each protection job applies to a single virtual machine. Virtual machines using ESX raw or independent disks are not supported. If your virtual machine is configured to use thin (sparse disks), the replica on the target will not be a thin disk. Make sure there is adequate space on the target. The virtual machine name cannot contain any of the following special characters. # / \ : * ? ' " < > | |
Specify the target ESX server that will store the replica virtual machine.
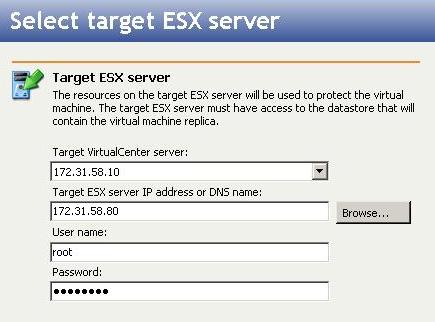
Select a datastore on the target where the source virtual machine data will be replicated.
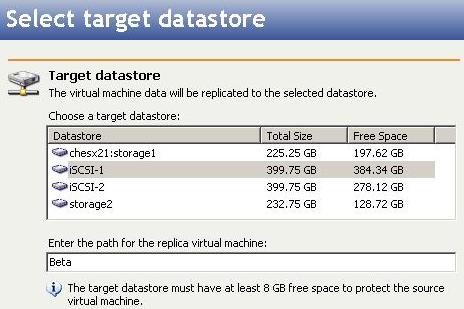
| Note: |
The replica virtual path cannot contain any of the following special characters. # / \ : * ? ' " < > | By specifying a datastore and path with an existing virtual disk, you can reuse an existing virtual machine created by a previous protection job. This can be useful for pre-staging data on a virtual machine over a LAN connection and then relocating it to a remote site after the initial mirror is complete. When you reuse a virtual machine, Double-Take Availability for VMware Infrastructure performs a difference mirror which saves times. Use the following steps to reuse a virtual machine.
|
Configure the replica virtual machine.
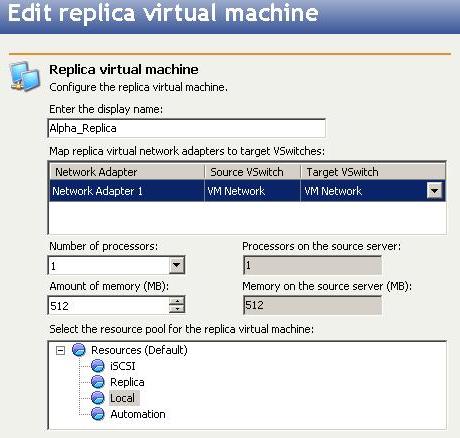
Enter the display name—Specify the name for the replica virtual machine. The name cannot contain any of the following special characters.
# / \ : * ? " " < > |
| Note: |
The target virtual machine is registered when replication is started and will remain registered. To unregister a machine, you must click Delete Protection and choose Delete the associated replica virtual machine. Even though the target virtual machine appears to be available on the ESX server, it should not be powered on, removed, or modified while it is owned by an active protection job, otherwise the target virtual machine will become corrupt and break the protection job. Do not attempt to manually create or delete snapshots on the protected virtual machine. This will disrupt the protection of the virtual machine and may generate unpredictable results on the source and target virtual machines. Double-Take Availability for VMware Infrastructure supports generic SCSI device mappings in virtual machines, however, the generic SCSCI device will not be created on the target virtual machine during failover because the target virtual machine will fail to start if the SCSI device hardware does not exist on the target ESX host. After failback, the generic SCSI device will be mapped back to the original source, but the SCSI device will not be mapped back to the original source if the protection job is re-created in the reverse direction. |
Optional protection settings are available when configuring an ESX to ESX protection job, but they are not required. The options are available at the end of the workflow when you are establishing protection or from the Monitor protection page when you click Configure Protection.
| Note: |
A snapshot transmission cycle will begin when either of the time or size threshold conditions are met. During the snapshot transmission cycle, the thresholds are not monitored. After the snapshot transmission cycle has completed, the application will again monitor the thresholds. If either of the thresholds were crossed during the snapshot transmission cycle, a new transmission cycle will begin immediately. You may want to adjust the snapshot transmission options to optimize performance in your environment. Some factors you need to consider when adjusting these settings include the volume of write traffic in the virtual machine, the allowed data loss time period, and the cost to the virtual infrastructure. |
| Note: |
In order to use e-mail notification, you may need to complete any or all of the following on the Double-Take Availability for VMware Infrastructure server.
|
| Note: | The following error message indicates anti-virus software on the server may be blocking outbound e-mail messages. "Failure sending mail. Unable to connect to the remote server. An established connection was aborted by the software in your host machine." |
If your source and target are on opposite sides of a firewall, you will need to configure your hardware to accommodate communications. You must have the hardware already in place and know how to configure the hardware ports. If you do not, see the reference manual for your hardware.
These firewall instructions are for the following protection scenarios.
By default, Double-Take Availability uses port 6320 for all communications. To verify or modify the ports, you must use the Replication Console.
Double-Take Availability uses ICMP pings to monitor the source for failover. A failover monitor will not be created if ICMP is blocked (although the data and system state will still be protected). You should configure your hardware to allow ICMP pings between the source and target. If you cannot, you will have to monitor for a failure manually and create a dummy monitor at failover time that can be manually failed over. Contact technical support for assistance with this manual process.
Virtual workload protection uses WMI (Windows Management Instrumentation) which uses RPC (Remote Procedure Call). By default, RPC will use ports at random above 1024, and these ports must be open on your firewall. RPC ports can be configured to a specific range by specific registry changes and a reboot. See the Microsoft Knowledge Base article 154596 for instructions.
Virtual workload protections also rely on other Microsoft Windows ports.
These ports must be open on your firewall. Check your Microsoft documentation if you need to modify these ports.
You need to configure your hardware so that the Double-Take Availability ports and Microsoft Windows ports are open. Since communication occurs bidirectionally, make sure you configure both incoming and outgoing traffic.
There are many types of hardware on the market, and each can be configured differently. See your hardware reference manual for instructions on setting up your particular router.
Your cluster protection will depend on the type of cluster configuration you are using.
Use the following steps to protect a standard cluster, where a single copy of data resides on a SCSI disk that is shared between cluster nodes. You will be using the Double-Take Source Connection cluster resource to protect your standard cluster.
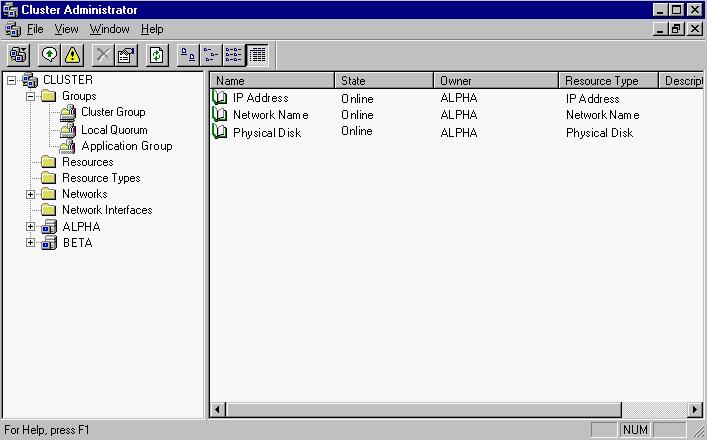
| Note: |
If your source is a cluster, you need to create the replication set on the node which currently owns the group with the virtual server you want to protect. |
| Note: |
The default number of files that are listed in the right pane of the Replication Console is 2500, but this is user configurable. A larger number of file listings allows you to see more files in the Replication Console, but results in a slower display rate. A smaller number of file listings displays faster, but may not show all files contained in the directory. To change the number of files displayed, select File, Options and adjust the File Listings slider bar to the desired number. To hide offline files, such as those generated by snapshot applications, select File, Options and disable Display Offline Files. Offline files and folders are denoted by the arrow over the lower left corner of the folder or file icon. |
| Note: |
As an alternative to the following manual steps, you can stop the Double-Take service on the other nodes of the source cluster, copy the file DblTake.db from the first node to the other nodes, and then restart the Double-Take service. |
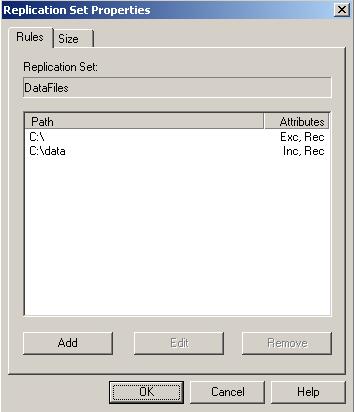
| Note: |
Each replication set rule on the non-owning nodes must be identical to the replication set rule on the owning node. |
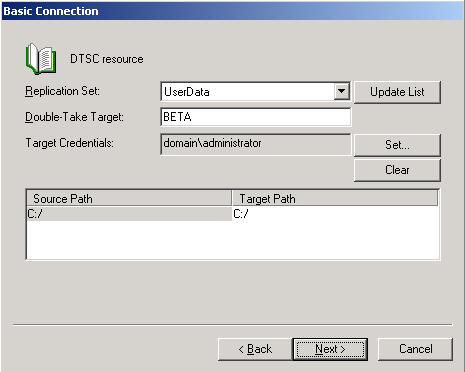
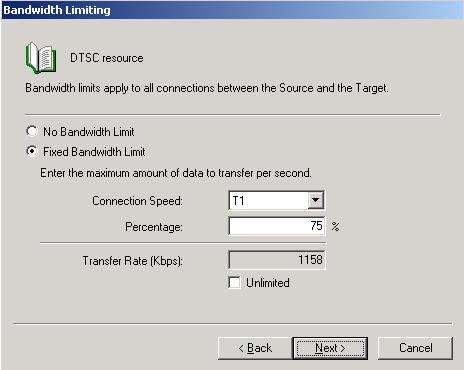
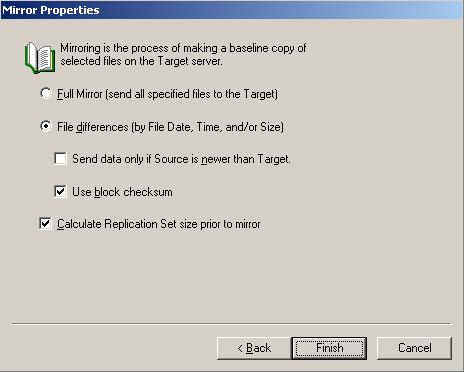
| Note: |
If you are using a database application, do not use the newer option unless you know for certain you need it. With database applications, it is critical that all files, not just some of them that might be newer, get mirrored. |
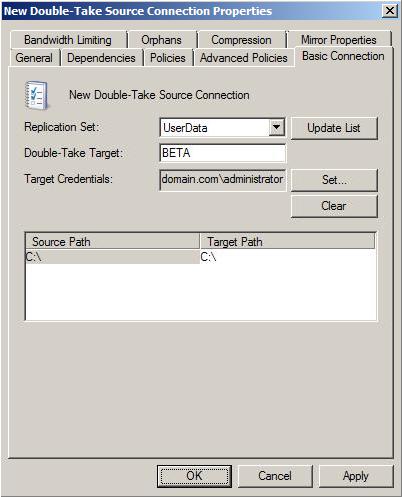
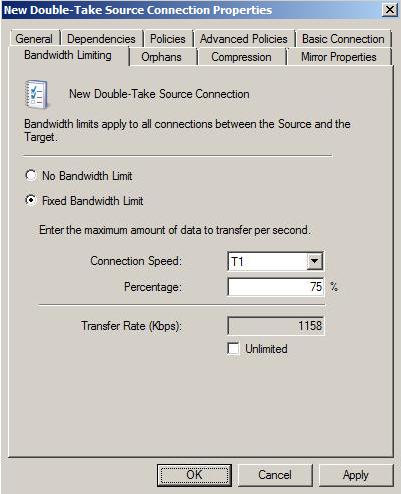
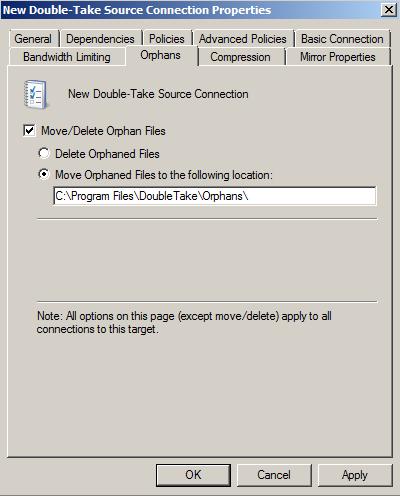
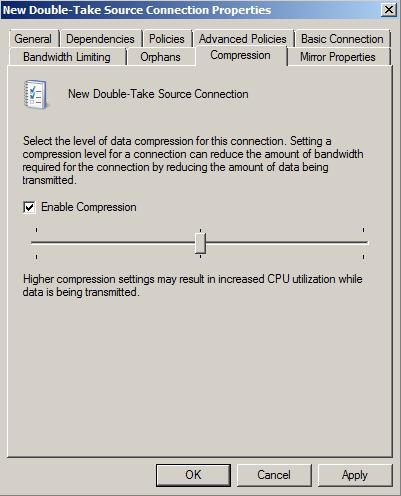
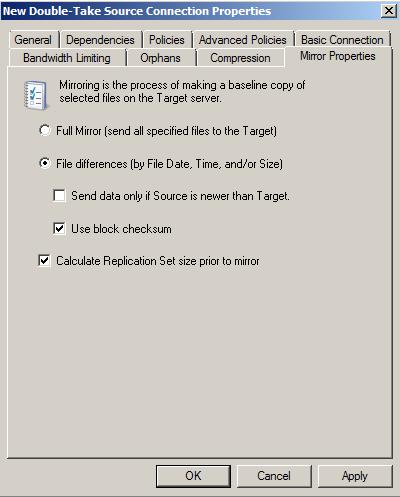
| Note: |
If you are using a database application, do not use the newer option unless you know for certain you need it. With database applications, it is critical that all files, not just some of them that might be newer, get mirrored. |
The GeoCluster Replicated Disk resource allows for the real-time copy of data to be available on other nodes in the cluster. In the event of a failure and another node takes ownership, the GeoCluster Replicated Disk resource is also moved to the other node and it continues to replicate data, in real-time, to the remaining nodes in the cluster.
The instructions for creating this resource are different depending on your operating system.
| Note: | If you are using a database application, do not use the newer option unless you know for certain you need it. With database applications, it is critical that all files, not just some of them that might be newer, get mirrored. |
| Note: |
If you are using Hyper-V, select the drive where the virtual machine .vhd file is stored. |
cluster res "New Geocluster Replicated Disk" /priv sourcefailoverdelay=15
The GeoCluster Replicated Disk will mirror and replicate the virtual machine data to the other cluster nodes.
To control the resource, you can bring it online and take it offline. Neither of these actions trigger failover. They just control the activity of the resource.
The GeoCluster Replicated Disk resource will appear offline after it is created. When you bring it online, the following actions occur.
If you are using Windows 2003, right-click the resource and select Bring online.
If you are using Windows 2008, right-click the resource and select Bring this resource online.
When you take the GeoCluster Replicated Disk resource offline, the following actions occur.
If you are using Windows 2003, right-click the resource and select Take offline.
If you are using Windows 2008, right-click the resource and select Take this resource offline.
| Note: | If the GeoCluster Replicated Disk Resource is offline, data integrity cannot be guaranteed on the other nodes in the cluster. |
Resource properties are displayed differently in Windows 2003 and Windows 2008. For example, the possible owners of a resource is listed on the General tab of the resource properties in Windows 2003, while in Windows 2008 they are listed on the Advanced Policies tab.
For both operating systems, right-click the resource and select Properties, when you want to view or modify the resource properties.
There are six properties tabs for the GeoCluster Replicated Disk resource on Windows 2003.
Modifying the Possible Owners list will cause one of the following actions to occur.
The GeoCluster Replicated Disk resource must have at least two possible owners to function properly.
For more information on the Advanced Settings options, see your Windows documentation.
Ideally, the networks used for various traffic should be separated. This is dependent on the number of networks that you established when you created the cluster and the priority assigned to each network. For example, if you have two network routes, separate GeoCluster and your public traffic. If you have three routes, separate the public traffic and then separate GeoCluster from the cluster heartbeat.
Modifications to either of the first two settings will not take effect until the next time the resource is brought online.
| Note: |
If you are using a database application, do not use the newer option unless you know for certain you need it. With database applications, it is critical that all files, not just some of them that might be newer, get mirrored. |
There are eight properties tabs for the GeoCluster Replicated Disk resource on Windows 2008.
For more information on Policies options, see your Windows documentation.
The GeoCluster Replicated Disk resource must have at least two possible owners to function properly.
For more information on Advanced Policies options, see your Windows documentation.
Ideally, the networks used for various traffic should be separated. This is dependent on the number of networks that you established when you created the cluster and the priority assigned to each network. For example, if you have two network routes, separate GeoCluster and your public traffic. If you have three routes, separate the public traffic and then separate GeoCluster from the cluster heartbeat.
Modifications to either of the first two settings will not take effect until the next time the resource is brought online.
| Note: |
If you are using a database application, do not use the newer option unless you know for certain you need it. With database applications, it is critical that all files, not just some of them that might be newer, get mirrored. |
If you are configuring failover monitoring for a cluster workload, use the same process for a data workload, except note the following changes.
Cluster resource “IP_Address_Resource_Name” /OFFLINE
The post-failback script must contain the following case-sensitive command, substituting the name of the group on the target virtual server.
Cluster group “Group_Name” /ONLINE
Double-Take Availability can be implemented with very little configuration necessary in small or simple networks, but additional configuration may be required in large or complex environments. Because an infinite number of network configurations and environments exist, it is difficult to identify all of the possible configurations. Select a link to review configuration information for particular network environments.
Failover of domain controllers is dependent on the Double-Take Availability functionality you are using.
Because NetBIOS is not available on Windows 2008, if you are using Windows 2008 in a workgroup environment and do not have DNS host records, there may be a delay of up to five minutes before the failed over source server name is available for client access. See About the NetBIOS Interface in the MSDN library.
When Double-Take Availability failover occurs, Windows initiates WINS registration with the target’s primary WINS server to associate the source server’s name with the target’s primary IP address. In an environment with just one WINS server, no additional processing is required. In an environment with more than one WINS server, WINS replication will distribute the updated WINS registration to other WINS servers on the network. The length of time required for all WINS servers to obtain the new registration depends on the number of WINS servers, the WINS replication architecture, and the WINS replication interval. Clients will be unable to access the target until their WINS server has received the updated WINS information. You can reduce the time required for the WINS updates, thereby decreasing the wait time for the end users, by scripting the WINS updates in the Double-Take Availabilityfailover scripts. You have two options for scripting the WINS updates.
WINS registration can be added to your failover and failback scripts by using the Windows NETSH command with the WINS add name context. Add the following command to your failover and failback scripts for each additional WINS server in your environment (excluding the target’s primary WINS server).
netsh wins server wins_server_IP_address add name Name=source_server_name RecType=1 IP={IP_address}
| Variable | Description |
|---|---|
| wins_server_IP_address | The IP address of the WINS server |
| source_server_name | The name of the source server |
| IP_address | The IP address of the target that has taken over for the failed source (for the failover script) or the IP address of the source that is reassuming its original identity (for the failback script) |
For example, suppose you had the following environment.
You would add the following to your failover script to register the source’s name with the target’s IP address on the two secondary WINS servers.
|
netsh wins server 192.168.1.110 add name Name=Alpha RecType=1 IP={116.123.2.47} netsh wins server 150.172.114.74 add name Name=Alpha RecType=1 IP={116.123.2.47} |
You would add the following to your failback script to register the source’s name back with the source’s original IP address on the two secondary WINS servers.
|
netsh wins server 192.168.1.110 add name Name=Alpha RecType=1 IP={192.168.1.108} netsh wins server 150.172.114.74 add name Name=Alpha RecType=1 IP={192.168.1.108} |
See your Windows documentation or the Microsoft web site for more details on the NETSH command.
WINS replication can be added to your failover and failback scripts by using the Windows NETSH command with the WINS set replicate context. Add the following command to your failover and failback scripts.
netsh wins server target’s_primary_wins_server_IP_address set replicateflag 1
| Variable | Description |
|---|---|
| target's_primary_wins_server_IP_address | The IP address of the target's primary WINS server |
For example, suppose you had the following environment.
You would add the following to your failover script to force the target’s primary WINS server to replicate its updated information to the other secondary WINS servers on the network.
| netsh wins server 116.123.2.50 set replicateflag 1 |
You would add the same line to your failback script to force the target’s primary WINS server to replicate its updated information again. This would replicate information for the source’s name and the source’s original IP address to the other secondary WINS servers on the network.
| netsh wins server 116.123.2.50 set replicateflag 1 |
See your Windows documentation or the Microsoft web site for more details on the NETSH command.
If you are using a Microsoft DNS server, when Double-Take Availability failover occurs, DNS is not automatically updated. If the end-users use DNS to resolve server names and the source IP address was not failed over to the target, additional DNS updates will be required because the host records for the source will remain intact after failover. You can automate this process by scripting the DNS updates in the failover and failback scripts. You have two options for scripting the DNS updates.
DNS updates can be added to your failover and failback scripts by using the Windows DNSCMD command as long as dynamic updates are enabled on the DNS zone and the account running the Double-Take service is a member of the DNSAdmins security group. (See your Microsoft documentation to verify if dynamic updates are enabled.) Add the following commands to your failover and failback scripts to delete the host and reverse lookup entries and add new entries associating the source to the target.
| Variable | Description |
|---|---|
| DNS_servers’s_FQDN | The fully qualified domain name of the DNS server |
| DNS_zone | The name of the DNS zone |
| source_server_name | The name of the source server |
| source_server_IP_address | The IP address on the source |
| www.xxx | The first two octets of the source’s IP address. For example, if the source’s IP address is 192.168.1.108, this variable would be 192.168. |
| zzz.yyy | The last two octets, in reverse order, of the source’s IP address. For example, if the source’s IP address is 192.168.1.108, this variable would be 108.1. |
| source_server’s_FQDN | The fully qualified domain name of the source server |
| target_server_IP_address | The IP address on the source |
| aaa.bbb |
The first two octets of the target’s IP address. For example, if the target’s IP address is 116.123.2.47, this variable would be 116.123. |
| ddd.ccc |
The last two octets, in reverse order, of the target’s IP address. For example, if the target’s IP address is 116.123.2.47, this variable would be 47.2. |
For example, suppose you had the following environment.
You would add the following to your failover script to delete the host and reverse lookup entries and add new entries associating the source to the target.
|
dnscmd DNSServer.domain.com /RecordDelete domain.com alpha A 192.168.1.108 /f dnscmd DNSServer.domain.com /RecordDelete 192.168.in-addr.arpa 108.1 PTR alpha.domain.com /f dnscmd DNSServer.domain.com /RecordAdd domain.com alpha A 116.123.2.47 dnscmd DNSServer.domain.com /RecordAdd 116.123.in-addr.arpa 47.2 PTR alpha.domain.com |
You would add the following to your failback script to delete the host and reverse lookup entries and add new entries associating the source with its original identity.
|
dnscmd DNSServer.domain.com /RecordDelete domain.com alpha A 116.123.2.47 /f dnscmd DNSServer.domain.com /RecordDelete 116.123.in-addr.arpa 47.2 PTR alpha.domain.com /f dnscmd DNSServer.domain.com /RecordAdd domain.com alpha A 192.168.1.108 dnscmd DNSServer.domain.com /RecordAdd 192.168.in-addr.arpa 108.1 PTR alpha.domain.com |
See your Windows documentation or the Microsoft web site for more details on the DNSCMD command.
DNS updates can be added to your failover and failback scripts by using the Double-Take Availability DFO utility as long as the utility has been registered and the proper privileges are configured.
| Command | DFO |
| Description | Used in script files to failover the DNS server name |
| Syntax |
DFO [/DNSSRVNAME <dns_server_name>] /SRCNAME <source_fqd_name> /SRCIP <source_ip> /TARIP <target_ip> /TARNAME <target_fqd_name> [/RECORDTYPE <rec_type>] [/USERNAME <user_name> /PASSWORD <password>] [/DNSZONE <zone_name>] [/DNSDOMAIN <domain_name>] [/LOGFILE <file_name>] /FAILBACK [fb_switch] [/SETPASSWORD <user_name> <password>[machine][file]] [/GETPASSWORD] [/LOCK] [/UNLOCK] /TRUSTEE <trustee_name> [/VERBOSE] [/FLUSHDNS /MACHINE <machine_fqd_name>] [/TTL <seconds>] [/ADDOMAIN <active_directory_domain_name> [/SOURCEDN <source_domain_name> [/TEST] [/DEBUG] [/HELP] |
| Options |
|
| Examples |
|
If you are using a non-Microsoft DNS server (such as Unix) or if you are in a non-domain configuration (such as a workgroup), when Double-Take Availability failover occurs, DNS is not automatically updated. If the end-users use DNS to resolve server names and the source IP address was not failed over to the target, additional DNS updates will be required because the host records for the source will remain intact after failover. You can automate this process by scripting the DNS updates in the failover and failback scripts.
If you are protecting an application, you can configure the Application Manager not to check for Microsoft DNS or you can start the Application Manager from the command line and specify the /altdns option after your application switch.
For other workload protections, one option is to use a BIND DNS client for DNS scripting. The following steps provide an example of how you can use a BIND DNS client for DNS failover and failback scripting. You may need to modify this example to fit your environment.
| nsupdate.exe "c:\install_location\dnsover.txt" |
|
update delete source_server_name.fully_qualified_domain_name.com A update add target_server_name.fully_qualified_domain_name.com 86400 A target_server_IP_address send |
| nsupdate.exe "c:\install_location\dnsback.txt" |
|
update delete target_server_name.fully_qualified_domain_name.com A update add source_server_name.fully_qualified_domain_name.com 86400 A source_server_IP_address send |
A share is any volume, drive, or directory resource that is shared across a network. During failover, the target can assume or add any source shares so that they remain accessible to the end users. Automatic share failover only occurs for standard Windows file system shares. Other shares, including Macintosh volumes, must be configured for failover through the failover scripts or created manually on the target.
| Note: |
You can automate the creation of the volumes during the failover process by using the macfile volume command in the post-failover batch file. For detailed information on how to use this command, see your Windows reference guide. |
|
rem Commands for Macintosh-accessible volume failover rem The chngname utility (chngname.exe) must be located in the same rem directory where Double-Take Availability is installed. rem The following command temporarily changes the name of the server. You rem will need to replace <drive>:\<directory>\ with the location of rem your Double-Take Availability chngname utility and replace rem source_name with the name of the source machine. <drive>\<directory>\chngname /s source_name rem The following command starts the File Server for Macintosh service net start "File server for Macintosh" rem The following command changes the name of the server back to its rem original name. You will need to replace <drive>:\<directory>\ with rem the location of your Double-Take Availability chngname utility. <drive>\<directory>\chngname /t |
In the event of a failure, the Macintosh clients must remap the volume in order to access it. From the Macintosh client, use the Chooser to select the volume that needs to be remapped.
A share is any volume, drive, or directory resource that is shared across a network. During failover, the target can assume or add any source shares so that they remain accessible to the end users. Automatic share failover only occurs for standard Windows file system shares. Other shares, including NFS shares, must be configured for failover through the failover scripts or created manually on the target.
|
rem Commands for NFS share failover rem The chngname utility (chngname.exe) must be located in the same rem directory where Double-Take Availability is installed. rem The following command temporarily changes the name of the server. You rem will need to replace <drive>:\<directory>\ with the location of rem your Double-Take Availability chngname utility and replace rem source_name with the name of the source machine. <drive>\<directory>\chngname /s source_name rem The following command starts the NFS service net start "Server for NFS" |
In the event of a failure, the clients must remount the shares in order to access them.
Once a workload protection is established you will want to monitor the protection. You can monitor the workload protection using the same Double-Take Availability client that you used to establish the workload protection, or you can use several general monitoring tools that are available for all workload types.
When you are working with data workloads, you can monitor the connection and you can monitor the status of failover monitoring.
When a source is highlighted in the left pane of the Replication Console, the connections and their statistics are displayed in the right pane. Additionally, colors and icons are used for the connections, and the Double-Take Availability servers, to help you monitor your connections.
Statistics marked with an asterisk (*) are not displayed, by default.
| Statistic | Description |
|---|---|
| Replication Set | Replication set indicates the name of the connected replication set. |
| Connection ID | The connection ID is the incremental counter used to number each connection established. This number is reset to one each time the Double-Take service is restarted. |
| Target Name | The name of the target as it appears in the server tree in the left pane of the Replication Console. If the server’s name is not in the server tree, the IP address will be displayed. |
| Target IP | The target IP is the IP address on the target machine where the mirroring and replication data is being transmitted. |
| Target Data State |
|
| Target Status |
This field may not be updated until there is source/target activity. |
| Commit Mode * |
The commit mode status indicates the connection status.
|
| Transmit Mode |
|
| Mirror Status |
|
| Replication Status |
|
| Queued (Ops) * | The queued (ops) statistic indicates the total number of mirror and replication operations that are in the source queue. |
| Sent (Bytes) | The sent (bytes) statistic indicates the total number of mirror and replication bytes that have been transmitted to the target. |
| Sent Compressed (Bytes) | The sent compressed (bytes) statistic indicates the total number of compressed mirror and replication bytes that have been transmitted to the target. If compression is disabled, this statistic will be the same as sent (bytes). |
| Intermediate Queue (Bytes) * | The intermediate queue (bytes) indicates the total amount of memory being used by the operations buffer queue. |
| Disk Queue (Bytes) | The disk queue (bytes) indicates the amount of disk being used to queue data on the source. |
| Queued Replication (Bytes) | The queued replication (bytes) statistic is the total number of replication bytes that are remaining to be transmitted from the source. |
| Sent Replication (Bytes) | The sent replication (bytes) statistic is the total number of replication bytes that have been transmitted to the target. |
| Sent Compressed Replication (Bytes) * | The sent compressed replication (bytes) statistic is the total number of compressed replication bytes that have been transmitted to the target. If compression is disabled, this statistic will be the same as sent replication (bytes). |
| Queued Mirror (Ops) * | The queue mirror (ops) statistic is the total number of mirror operations in the queue. |
| Sent Mirror (Bytes) | The sent mirror (bytes) statistic is the total number of mirror bytes that have been transmitted to the target. |
| Sent Compressed Mirror (Bytes) * | The sent compressed mirror (bytes) statistic is the total number of compressed mirror bytes that have been transmitted to the target. If compression is disabled, this statistic will be the same as sent mirror (bytes). |
| Skipped Mirror (Bytes) | The skipped mirror (bytes) statistic is the total number of bytes that have been skipped when performing a difference or checksum mirror. These bytes are skipped because the data is not different on the source and target machines. |
| Remaining Mirror (Bytes) | The remaining mirror (bytes) statistic is the total number of mirror bytes that are remaining to be sent to the target. |
| Queued Replication (Ops) * | The queued replication (ops) statistic is the total number of replication operations in the queue. |
| Last File Touched | The last file touched identifies the last file that Double-Take Availability transmitted to the target. If you are using long file names (more than several thousand characters long) you may want to disable the display of this statistic to improve Replication Console response times. |
| Connected Since | Connected since is the date and time indicating when the current connection was made. This field is blank, indicating that a TCP/IP socket is not present, when the connection is waiting on transmit options or if the transmission has been stopped. This field will maintain the date and time, indicating that a TCP/IP socket is present, when transmission has been paused. |
| Bandwidth Limit (Kbps) | If bandwidth limiting has been set, this statistic identifies the limit. The keyword Unlimited means there is no bandwidth limit set for the connection. |
You can configure when the icons and colors change to accommodate your network environment. For example, a slow or busy network may need longer delays before updating the icons or colors.
| Note: |
If the Site Monitor and Connection Monitor settings are different, at times, the icons and color may not be synchronized between the left and right panes. |
| Location | Icon or Color | Description |
|---|---|---|
| Icons and colors displayed in the right pane when a server is highlighted in the left pane |
|
A green checkmark on a connection indicates the connection is working properly. |
|
|
A red X on a connection indicates a connection error. For example, an error may be caused by broken transmission or pending replication. To determine the exact problem, locate the connection data item that appears in red. | |
|
|
A lock icon on a connection indicates target path blocking is enabled for the connection. This prohibits writing to the path on the target where the replication data is stored. | |
| White | If the connection background is white, the Replication Console and the source are communicating. | |
| Gray | If the connection background is gray, the Replication Console and the source are no longer communicating. The connection data stops updating once communications have stopped. Once communications have been reestablished, the connection background will change back to white. | |
| Icons displayed in the right pane when a group is highlighted in the left pane |
|
An icon with a network cable between two servers on the right pane indicates there are no established Double-Take Availability connections to this server. This icon also indicates that communications between the Replication Console and the server are working properly. |
|
|
An icon with two servers on the right pane indicates this server has active connections that are working properly. | |
|
|
A yellow server icon with a red X on the right pane indicates a connection error. For example, an error may be caused by broken transmission or pending replication. To determine the exact problem, locate the connection data item that appears in red. | |
|
|
An icon with a network cable between two servers and marked with a red X on the right pane indicates a communication error between the Replication Console and the server. | |
|
|
A blue server icon with a red X indicates a restore is required because of a failover. | |
|
|
A network cable with a black X indicates the server is not running Double-Take Availability. | |
| Left pane icon |
|
An icon with yellow and blue servers indicates a server that is working properly. |
|
|
A hammer over a server indicates an activation code violation. Check the Double-Take Availability log or Event messages for more information. | |
|
|
A red X on a server icon indicates the Replication Console cannot communicate with that server or that is a problem with one of the server’s connections. If the connection background is gray, it is a communication issue. If the connection also has a red X, it is a connection issue. | |
|
|
Two red vertical lines on a server icon indicates the target is paused. | |
|
|
A red tree view (folder structure) on a server icon indicates a restore is required because of a failover. | |
|
|
A black X on a server icon indicates the server is not running Double-Take Availability. | |
|
|
A yellow folder with a blue server indicates a group folder that is working properly. | |
|
|
A black exclamation point inside a yellow triangle on a group folder indicates there is a communication error on one of the servers in the group. Drill down through the group until you find the server that has the communication error. | |
|
|
A white X inside a red circle on a group folder indicates there is a connection error on one of the servers in the group. Drill down through the group until you find the server that has the connection error. |
Since it can be essential to quickly know the status of failover monitoring, Double-Take Availability offers various methods for monitoring failover monitoring. When the Failover Control Center is running, you will see four visual indicators:
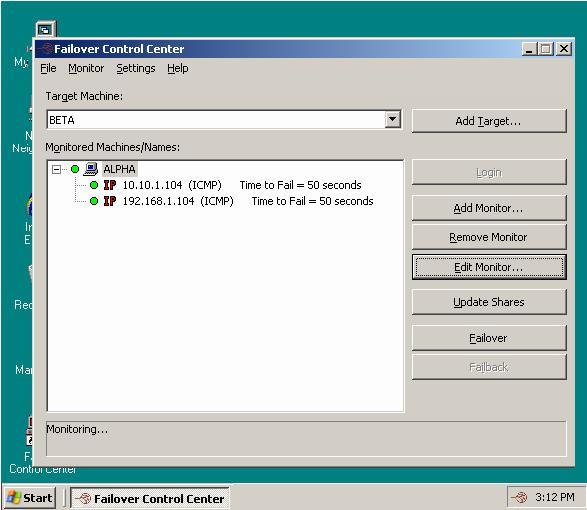
| Note: |
You can minimize the Failover Control Center and, although it will not appear in your Windows taskbar, it will still be active and the failover icon will still appear in the desktop icon tray. The Failover Control Center does not have to be running for failover to occur. |
The following table identifies how the visual indicators change as the status of failover changes.
| Time to Fail Countdown | Status Bar | Colored Bullets | Desktop Icon Tray | |
|---|---|---|---|---|
| Source is Online |
The Time to Fail counter is counting down and resetting each time a response is received from the source machine. |
The status bar indicates that the target machine is monitoring the source machine. |
The bullets are green. When the Time to Fail value has decreased by 25% of the entire timeout period, the bullet changes from green to yellow, indicating that the target has not received a response from the source. The yellow bullet is a caution signal. If a response from the source is received, the countdown resets and the bullets change back to green. If the countdown reaches zero without the target receiving a response from the source, failover begins. |
The Windows desktop icon tray contains a failover icon with red and green computers. |
| Source Fails and Failover is Initiated | The Time to Fail countdown value is 0. | The status bar displays the source machine and IP address currently being assumed by the target. |
The bullets are red. |
The Windows desktop icon tray contains a failover icon with red and green computers. |
| Failover is Complete | The Time to Fail counter is replaced with a failed message. |
The status bar indicates that monitoring has continued. |
The bullets are red. |
The Windows desktop icon tray contains a failover icon with a red computer. |
After you have enabled full-server protection, you can monitor the protection from the Full-Server Failover Manager, and you can review the log file generated by Full-Server Failover Manager.
The Protection Status is displayed in the right center of the Full-Server Failover Manager. You can tell the status of your protection from this field.

In addition to the status displayed in Full-Server Failover Manager, a log file is generated detailing processing information. By default, Full-Server Failover Manager logs basic processing information. To view the log file, select File, Logs, View Full-Server Failover Manager Log. The log file will be opened automatically in Notepad. The log file, FFMLog.log, is located on the in the directory where you installed it. You can clear the log file by selecting File, Logs, Clear Full-Server Failover Manager Log.
After you have enabled application protection, you can monitor the protection from the Application Manager Monitor tab.
| Monitor Section | Status Item | Description |
|---|---|---|
| Status | Protection Status |
|
| Monitoring Status |
|
|
| Protection Details | Mirror Status |
|
| Mirror Remaining | The percentage of the mirror remaining | |
| Replication Status |
|
|
| Transmit Mode |
|
|
| Target State |
|
|
| Connected Since | The date and time indicating when the current connection was made | |
| Transmitted | The amount of data transmitted from the source to the target | |
| Compressed | The amount of compressed data transmitted from the source to the target | |
| Source Queue | The amount of data in queue on the source | |
| Target Queue | The amount of data in queue on the target |
When you are working with virtual workloads, you can monitor the connection and you can monitor the status of failover monitoring. If you are protecting host-level virtual disk files (the .vmdk files) from an ESX source to an ESX target, you will need to use the Double-Take Availability for VMware Infrastructure console to monitor your protection. For all other virtual workloads, use the Double-Take Console to monitor your protection.
Click Monitor Connections from the main Double-Take Console toolbar. The Monitor Connections page allows you to view information about your connections. You can also manage your connections from this page.
The top pane displays high-level overview information about your connections.
| Column | Description |
|---|---|
|
The first blank column indicates the state of the connection.
|
|
| Connection | The name of the connection |
| Source Server | The name of the source |
| Target Server | The name of the target |
| Replication Set | The name of the replication set |
| Activity | There are many different Activity messages that keep you informed of the connection activity. Most of the activity messages are informational and do not require any administrator interaction. If you see error messages, check the connection details. |
| Mirror Status |
|
| Replication Status |
|
| Transmit Mode |
|
You can filter the connections displayed in the top pane using the toolbar buttons in that pane.
| Toolbar Item | Description |
|---|---|
|
|
Leave the Monitor Connections page and open the View Connection Details page |
| Filter | Select a filter option from the drop-down list to only display certain connections. You can display Healthy Connections, Connections with warnings, or Connections with errors. To clear the filter, select All connections. |

|
Display only connections with warnings |

|
Display only connections with errors |
| Type a server name | Only those servers that contain the entered text will be displayed |
The details displayed in the bottom pane of the Monitor Connections page will depend on the type of protection workload that is highlighted in the top pane.
| Detail Item | Description |
|---|---|
| Name | The name of the server |
| Activity | There are many different Activity messages that keep you informed of the connection activity. Most of the activity messages are informational and do not require any administrator interaction. If you see error messages, check the connection details. |
| Source server | The name of the source |
| Target server | The name of the target |
| Bytes sent | The total number of mirror and replication bytes that have been transmitted to the target |
| Bytes sent compressed | The total number of compressed mirror and replication bytes that have been transmitted to the target. If compression is disabled, this statistic will be the same as Bytes sent. |
| Connected since | The date and time indicating when the current connection was made. This field is blank, indicating that a TCP/IP socket is not present, when the connection is waiting on transmit options or if the transmission has been stopped. This field will maintain the date and time, indicating that a TCP/IP socket is present, when transmission has been paused. |
| Protection type | The type of workload protection |
| Hypervisor | The type of target virtual server host |
| Protection status | The status of the workload protection |
| Protected volumes | The volumes that are being protected |
| Target datastore or Target path | The location on the target where the source replica is being stored |
| Automatic failover | Indicates if failover will be automatic and the number of retries that have been attempted if the source is unresponsive |
The connection controls available in the bottom pane of the Monitor Connections page will depend on the type of protection workload that is highlighted in the top pane.
| Toolbar Item | Description |
|---|---|

|
Opens the Protection Summary page |
|
|
Removes configuration information for the selected protection If you no longer want to protect the source and no longer need the replica of the source on the target, select the appropriate delete option when prompted. The option name will vary depending on your workload type. Selecting this option will remove the connection and completely delete the replica virtual machine on the target. If you no longer want to mirror and replicate data from the source to the target but still want to keep the replica of the source on the target, select the appropriate keep option when prompted. The option name will vary depending on the your workload type. For example, you may want to use this option to relocate the virtual hard disks and create a new job between the original source and the new location. Selecting this option, will preserve and register the source replica on the target, provided it has been fully synchronized. If the source replica is not fully synchronized, related files will be kept on the target but will not be registered. |

|
Enables protection for the selected protection If you have previously stopped protection, the virtual hard disks on the target will be checked. If they are the same as the source, replication only (no mirroring) will begin. If they are not the same but there is a file on the target, a difference mirror will begin. If you have previously paused protection, the protection job will resume where it left off. |

|
Pause the selected protection |

|
Stops the selected protection |

|
Initiate failover by shutting down the source and starting the replica of the source on the target |

|
For some workload types, you can undo failover after it has occurred. This resets the servers and the job back to their original state. |

|
For some workload types, you can reverse the protection. The connection will start mirroring in the reverse direction with the connection name and log file names changing accordingly. After the mirror is complete, the job will continue running in the opposite direction. |

|
Displays the most recent error associated with the selected protection |
The View Connection Details page allows you to view information about a specific connection.
| Category | Server Detail Item | Description |
|---|---|---|
| Properties | Connection name | The name of the connection |
| Description | The connection status | |
| Health |
|
|
| Activity |
There are many different Activity messages that keep you informed of the connection activity. Most of the activity messages are informational and do not require any administrator interaction. If you see error messages, check the rest of the connection details. |
|
| Replication set | The name of the replication set | |
| Connection ID | The incremental counter used to number each connection established. This number is reset to one each time the Double-Take service is restarted. | |
| Transmit mode |
|
|
| Target data state |
|
|
| Target route | The IP address on the target used for Double-Take Availability transmissions. | |
| Compression |
|
|
| Bandwidth limit | If bandwidth limiting has been set, this statistic identifies the limit. The keyword Unlimited means there is no bandwidth limit set for the connection. | |
| Connected since | The date and time indicating when the current connection was made. This field is blank, indicating that a TCP/IP socket is not present, when the connection is waiting on transmit options or if the transmission has been stopped. This field will maintain the date and time, indicating that a TCP/IP socket is present, when transmission has been paused. | |
| Statistics | Mirror status |
|
| Mirror percent complete | The percentage of the mirror that has been completed | |
| Mirror remaining | The total number of mirror bytes that are remaining to be sent from the source to the target | |
| Mirror skipped | The total number of bytes that have been skipped when performing a difference or checksum mirror. These bytes are skipped because the data is not different on the source and target. | |
| Replication status |
|
|
| Replication queue | The total number of replication bytes in the source queue | |
| Disk queue | The amount of disk space being used to queue data on the source | |
| Bytes sent | The total number of mirror and replication bytes that have been transmitted to the target | |
| Bytes sent compressed | The total number of compressed mirror and replication bytes that have been transmitted to the target. If compression is disabled, this statistic will be the same as Bytes sent. |
Select Monitor protection from the left pane of the console. The Monitor protection page allows you to view information about your connections. You can also manage your connections from this page.
The top pane displays high-level overview information about your connections.
| Column | Description |
|---|---|
| Name | The name of the connection |
| Status | A description of the current status of the protection |
| Bytes Pending | The remaining amount of data (.vmdk files plus snapshot files) that needs to be transmitted |
| Remaining Interval | The amount of time until the next replication cycle |
When the View protection details button in the toolbar is toggled on, the bottom pane displays detailed connection information.
| Section | Status Item | Description |
|---|---|---|
| Source | Virtual Disk | A list of the virtual disks being protected |
| Snapshot Data Size | The size of the snapshot of each virtual disk | |
| Last Modified | The last time the snapshot was updated | |
| Virtual machine name | The name of the virtual machine that contains the virtual disk being protected | |
| Snapshot datastore | The name of the datastore on the source storing the snapshot data | |
| Free space | The amount of free space on the source snapshot datastore | |
| Target | Virtual machine name | The name of the target replica virtual machine |
| Datastore | The name of the target datastore | |
| Free space | The amount of free space on the target datastore | |
| Last replication | The last time snapshot files were replicated to the target | |
| Last synchronization | The last time .vmdk files were mirrored to the target |
The connection controls are available in the toolbar of the Monitor protection page.
| Toolbar Item | Description |
|---|---|
|
|
Opens the Protection Summary page allowing you to modify some protection settings. |
|
|
Deletes the selected protection. You will be prompted to keep or delete the associated replica virtual machine on the target. If you do not need the replica on the target, you can delete it. However, if you want to keep the replica on the target, for example, if you want to being using the replica on the target as the production server, you can keep the replica. In this case, the replica will be preserved and registered (as long as the initial mirror has completed) allowing the virtual machine to be available in VirtualCenter. If the initial mirror has not completed, the files will be available on the target ESX server but will not be registered. |
|
|
Starts protection |
|
|
Stops protection |
|
|
Initiates failover by stopping the virtual machine on the source and starting the replica virtual machine on the target |
|
|
Initiate reverse protection by mirroring and replicating from the replica virtual machine on the target to the virtual machine on the source |
|
|
Initiate undo failover to reset the virtual machines and the protection job back to the original state |

|
View errors for the selected protection |

|
View details for the selected protection |
In a standard cluster configuration, where a single copy of data resides on a SCSI disk that is shared between cluster nodes, the Double-Take Source Connection resource keeps the data synchronized between your source and target. Use the standard Windows cluster tools to monitor the status of the resource.
In a GeoCluster configuration, where data is stored on volumes local to each node and replicated to each node in the cluster, the GeoCluster Replicated Disk resource keeps the data synchronized between nodes of the cluster. You should also use the standard Windows cluster tools to monitor the status of the resource, but you should also use the following information to help you monitor the GeoCluster Replication Disk resource.
When the GeoCluster Replicated Disk resource is in an online pending state, you are protected from possible data corruption. If you are using Windows 2003, review the description of the GeoCluster Replicated Disk Status resource to see why the GeoCluster Replicated Disk resource is in the online pending state. If you are using Windows 2008, you can see the online pending status directly in the description of the GeoCluster Replicated Disk resource. If the pending state were bypassed, the node where you are trying to bring the resource online would have incomplete data, which would then be replicated to the other nodes in the cluster. This state safeguards you from corrupting your data.
There are different options for resolving an online pending state, depending on whether your operating system supports snapshots. Therefore, some of the following options may not be displayed or may be disabled if they are not valid for your configuration.
If you are using Windows 2003, right-click on the online pending resource and select the desired control.
If you are using Windows 2008, right-click the online pending resource, select Properties, select the Online Pending tab, and click the desired control button.
| Windows 2003 | Windows 2008 | Description |
|---|---|---|
| Revert to snapshot | Revert Snapshot | If you have a snapshot of the target data available, you can revert to that data. If you revert to a snapshot, any data changes made after the snapshot’s specified date and time will be lost. A Double-Take Availability connection will be established to replicate the node’s data (at the snapshot point-in-time) to the other nodes. |
| Discard target queue | Flush Target | If you have data in the target queue, you can discard that data. If you discard the queued data, you will lose the changes associated with that data made on the previously owning node. A Double-Take Availability connection will be established to replicate the node’s data (without the data that was in queue) to the other nodes. |
| Force Resource Offline | Fail Resource | If you are using Windows 2003, you can force the resource offline. If you are using Windows 2008, you can fail the resource. In either case, no Double-Take Availabilityconnection will be established. |
| Verify Group | Test Data | With this option and snapshot capability, you can test the data on the node before deciding whether to use it. If you select this option, a snapshot of the node’s current Double-Take Availability data will be taken, but the GeoCluster Replicated Disk resource does not come online, allowing you to check the data. (This means there is no Double-Take Availability connection established at this time.) Once the snapshot is taken, you can test the data on the node to see if it is viable. Once you have tested the data, you need to right-click on the online pending resource again and accept or reject the data. |
| Accept Data | Accept | If you accept the data, the current data on the node will be used, and a Double-Take Availability connection will be established to replicate the current node’s data to the other nodes. If any other nodes in the cluster contain more recent data, this node will overwrite that data and it will be lost. |
| Reject Data | Reject | If you reject the data, the node will be reverted to the snapshot that was taken when you selected the Verify Group or Test Data option. Any changes made on the node after that snapshot was created will be lost. This option essentially takes you back to where you were, allowing you the opportunity to check other nodes for more recent data. |
The function of the GeoCluster Replicated Disk Status resource (also displayed as GRD Status) varies between Windows 2003 and Windows 2008. In both operating systems, it is automatically created when the first GeoCluster Replicated Disk resource is created in a group. Once the status resource is created, it will exist as long as there is a GeoCluster Replicated Disk resource in the group. When the last GeoCluster Replicated Disk resource in a group is deleted, the status resource will be deleted. Only one status resource is created per group.
If you are using Windows 2003, the description of the status resource corresponds to various states of your Double-Take Availability data. By reviewing the status descriptions, you can tell at-a-glance the state of your Double-Take Availability data. If you are using Windows 2008, these status descriptions are seen directly in the GeoCluster Replicated Disk resource description, rather than the GeoCluster Replicated Disk Status resource.
| Sample Status Resource Description | Double-Take Availability Data State |
|---|---|
| The status of all targets is OK. | The data on each target node is in a good state. |
|
The data on the specified target node is not in a good state. This could be because a mirror is in progress, an operation has been dropped on the target, or another Double-Take Availabilityprocessing issue. Check the Double-Take Availability logs for more information. As long as the status is pending, data integrity cannot be guaranteed on the specified target node. |
| Target target_name is queuing. Data in queue on target. | The data on the specified target is not up-to-date. Because there is data in queue on the target, that has not been written to disk yet, the target data is out-of-date. |
The text of the descriptions may vary between Windows 2003 and Windows 2008.
Another function of the status resource, for both Windows 2003 and Windows 2008, is to keep you from moving the GeoCluster Replicated Disk resource to another node at the wrong time and potentially corrupting your data. If the GeoCluster Replicated Disk resource was moved while the status resource is in a pending or queuing state, the new node would have incomplete data, which would then be replicated to the other nodes in the cluster. This resource safeguards you from corrupting your data.
Various Double-Take Availability components (Double-Take service, Replication Console, Failover Control Center, and the Command Line Client) generate a log file to gather alerts, which are notification, warning, and error messages. The log files are written to disk.
Each log file consists of a base name, a series number, and an extension.
| Component | Log File Base Name |
|---|---|
| Double-Take Availability | dtlog |
| Replication Console | mc |
| Failover Control Center | fcc |
| Command Line Client | dtcl |
| Component | Sample Log File Names |
|---|---|
| Double-Take Availability | dtlog1.dtl, dtlog2.dtl |
| Replication Console | mc1.dtl, mc2.dtl |
| Failover Control Center | fcc1.dtl, fcc2.dtl |
| Command Line Client | dtcl1.dtl, dtcl2.dtl |
You can view the Double-Take Availability log file through the
Repeat step 1 if you want to open multiple message windows.
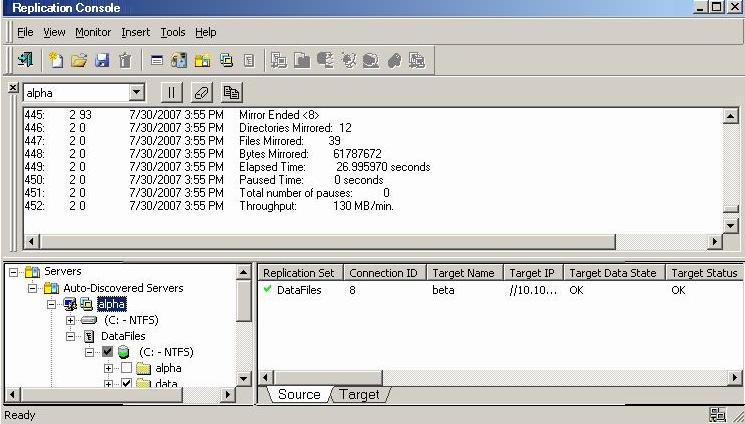
| Note: |
The standard appearance of the message window is a white background. If your message window has a gray background, the window is inactive. The Replication Console may have lost communications with that server, for example, or you may no longer be logged into that server. The message window is limited to the most recent 1000 lines. If any data is missing an entry in red will indicate the missing data. Regardless of the state of the message window, all data is maintained in the Double-Take Availability log on the server. |
| Message Window Control | Description | Toolbar Icon |
|---|---|---|
| Close |
Closes the message window |
|
| Clear |
Clears the message window |
|
| Pause/Resume |
Pauses and resumes the message window. Pausing prevents new messages from being displayed in the message window so that you are not returned to the bottom of the message window every time a new message arrives. The messages that occur while the window is logged are still logged to the Double-Take Availability log file. Resuming displays the messages that were held while the window was paused and continues to display any new messages. Pausing is automatically initiated if you scroll up in the message window. The display of new log messages will automatically resume when you scroll back to the bottom. |
|
| Copy |
Allows you to copy selected text |
|
| Options |
This control is only available from the Monitor menu. Currently, there are no filter options available so this option only allows you to select a different server. In the future, this control will allow you to filter which messages to display. |
The log files can be viewed, from the location where Double-Take Availability is installed, with a standard text editor.
The following table describes the information found in each column of the log file.
| Column Number | Description |
|---|---|
| 1 | The date the message was generated |
| 2 | The time the message was generated. |
| 3 | The process ID. |
| 4 | The thread ID. |
| 5 | The sequence number is an incremental counter that assigns a unique number to each message. |
| 6 |
The type or level of message displayed.
|
| 7 | The message ID. |
| 8 | The message text. |
|
01/15/2010 14:14:18.3900 95 98 2 2 69 Kernel Started 01/15/2010 14:14:18.4200 95 98 3 2 10004 Valid Activation Key Detected : 01/15/2010 14:14:18.5350 98 170 4 2 52501 Target module loaded successfully 01/15/2010 14:14:18.6760 98 172 5 2 10004 Valid Activation Key Detected : 01/15/2010 14:14:18.9870 130 131 6 2 51501 Source module loaded successfully 01/15/2010 14:24:15.2070 130 132 7 2 72 Connection Request from ip://206.31.4.305 01/15/2010 14:24:16.3090 131 133 8 2 600002 Unified login provides ADMIN access 01/15/2010 14:24:40.9680 132 134 9 2 99 RepSet Modified: UserData 01/15/2010 14:25:22.4070 134 131 10 2 71 Originator Attempting ip://206.31.4.305 01/15/2010 14:25:22.5030 134 131 11 2 0 Transmission Create to ip://206.31.4.305. 01/15/2010 14:25:22.6060 135 133 12 2 500000 UserData is connected to ip://206.31.4.305 01/15/2010 14:25:23.5030 136 98 13 2 87 Start Replication on connection 1 |
|
00/00/0000 00:00:00.0000 Application starting 09/11/2010 12:45:53.8980 704 1032 1 2 0 Could not find XML file: C:\Program Files\Double-Take Software\Double-Take\Administrator.xml, default groups will be added. 09/11/2010 12:45:53.9580 704 1032 2 2 0 Adding default group: Double-Take Servers 09/11/2010 12:45:53.9580 704 1032 3 2 0 Adding default group: Double-Take Servers\ Auto-Discovered Servers 09/11/2010 12:46:08.3390 704 1032 4 210004 Evaluation license expires in 95 day(s). |
Log file output can be filtered using the LogViewer utility. Use the LogViewer command from the directory where Double-Take Availability is installed.
| Command | LOGVIEWER |
| Description | The Double-Take Availability logging utility that filtersDouble-Take Availability log files |
| Syntax | LOGVIEWER [-PATH <path>] [-TYPE <number>] [-INCLUDE <list>] [-EXCLUDE <list>] [-NODATE] [-NOTIME] [-NOPID] [-NOTID] [-NOSEQ] [-NOTYPE] [-NOID] [-HELP] |
| Options |
|
| Examples |
|
| Notes | The default setting is -type 2 which displays both type 1 and 2 messages. |
| Note: | If you change the Maximum Length or Maximum Files, you must restart the Double-Take service for the change to take effect. |
The following table describes some of the standard Double-Take Availability alerts that may be displayed in the log files.
| Note: | In the following table, con_id refers to the unique connection ID assigned to each connection between a source replication set and a target. |
| ID | Message | Description |
|---|---|---|
| 0 | N/A | There are several log messages with this ID#. See the description in the Message column in the log file. |
| 7 |
|
|
| 69 | Double-Take kernel started on server_name | The Double-Take service was started on the Double-Take Availability server specified. |
| 70 | Double-Take kernel stopped | The Double-Take service was stopped on a Double-Take Availability server. |
| 71 | Originator attempting ip://xxx.xxx.xxx.xxx | A source is requesting to connect a replication set to a target machine. |
| 72 | Connection request from ip://xxx.xxx.xxx.xxx | A target machine has received a source machine’s request to connect a replication set to the target. |
| 73 | Connected to ip://xxx.xxx.xxx.xxx | A source machine has successfully connected a replication set to a target machine. |
| 74 | Connection paused with ip://xxx.xxx.xxx.xxx | A network connection between the source and the target exists and is available for data transmission, but data is being held in queue and is not being transmitted to the target. This happens because the target machine cannot write data to disk fast enough. Double-Take Availability will resolve this issue on its own by transmitting the data in queue when the target catches up. |
| 75 | Connection resumed with ip://xxx.xxx.xxx.xxx | The transmission of data from the source machine to the target machine has resumed. |
| 76 | Connection failed to ip://xxx.xxx.xxx.xxx | An attempt to establish a network connection between a source machine and target machine has failed. Check your network connections and verify that the target machine is still online. |
| 77 | Connection lost with IP address address | The network connection previously established between a source machine and target machine has been lost. Check your network connections and troubleshoot to see why the connection was lost. |
| 78 | Auto-disconnect threshold has been reached. | The Double-Take Availability queue has exceeded its limit, and the auto-disconnect process will disconnect the source and target connection. The auto-reconnect process will automatically reestablish the connection if the auto-reconnect feature is enabled. If the auto-reconnect feature is not enabled, you must first verify that the connection between the source and target has been broken, and then manually reestablish the connection in the Replication Console. |
| 79 | Memory freed to bring Double-Take memory usage below the limit | Data in the source queue has been sent to the target machine, bringing the pagefile below its limit. |
| 80 | Trying to auto-retransmit to ip://xxx.xxx.xxx.xxx | Double-Take Availability is attempting to automatically reconnect previously established source and target connections after a server reboot or auto-disconnect. This is also referred to as the auto-reconnect process. |
| 81 | Schedule transmit start to target | A scheduled transmission of data from a source machine to a target machine has started. See the description in the Message column in the log file. |
| 82 | Schedule transmit end to target | A scheduled transmission of data from a source machine to a target machine has ended. See the description in the Message column in the log file. |
| 85 | repset has been auto-disconnected | Double-Take Availability automatically disconnects the source and target connection because the queue size has reached a specified size for this action. |
| 87 | Start replication on connection con_id | Data has started replicating from a source machine to a target machine. |
| 88 | Stop replication on connection con_id | Data has stopped replicating from a source machine to a target machine. |
| 89 | Mirror started con_id | Data is being mirrored from a source machine to a target machine. |
| 90 | Mirror stopped con_id | The process of mirroring data from a source machine to a target machine has stopped due to user intervention or an auto-disconnect. (This means the mirroring process was not completed.) |
| 91 | Mirror paused con_id | The process of mirroring data from a source machine to a target machine has paused because the target machine cannot write the data to disk fast enough. Double-Take Availability will resolve this issue on its own by transmitting the data in queue when the target catches up. |
| 92 | Mirror resumed con_id | The process of mirroring data from a source machine to a target machine has resumed. |
| 93 | Mirror ended con_id | The process of mirroring data from a source machine to a target machine has ended. |
| 94 | Verification started con_id | The verification process of confirming that the Double-Take Availability data on the target is identical to the data on the source has started. |
| 95 | Verification ended con_id | The verification process of confirming that the Double-Take Availability data on the target is identical to the data on the source has ended. |
| 97 | Restore started con_id | The restoration process of copying the up-to-date data from the target back to the original source machine has started. |
| 98 | Restore completed con_id | The restoration process of copying the up-to-date data from the target back to the original source machine has been completed. |
| 99 | RepSet Modified: repset_ name | This message means that the specified replication set has been modified. |
| 100 | Failover condition has been met and user intervention is required | Double-Take Availability has determined that the source has failed, and requires manual intervention to start the failover process. |
| 101 | Failover in progress!!! | The conditions for failover to occur have been met, and the failover process has started. |
| 102 | Target full! | The disk to which data is being written on the target is full. This issue may be resolved by deleting files on the target machine or by adding another disk. |
| 801 | Auto-disconnect has occurred on IP address with connection con_id Disconnected replication set name: repset_name. | Auto-disconnect has occurred for the specified connection. This is due to the source queue filling up because of a network or target failure or bottleneck. |
| 10001 | Activation key is not valid. | An invalid activation code was identified when the Double-Take service was started. |
| 10002 | Evaluation period has expired. | The evaluation license has expired. |
| 10003 | Activation code violation with machine machine_name | Duplicate single-server activation codes are being used on the servers, and Double-Take Availability is disabled. |
| 10004 | Valid activation key detected | A valid activation code was identified when the Double-Take service was started. |
| 51001 | Source module failed to load | The Double-Take Availability source module failed to load. Look at previous log messages to determine the reason. (Look for messages that indicate that either the activation code was invalid or the user-configurable source module was not set to load automatically at startup.) The source module may have been configured this way intentionally. |
| 51501 | Source module loaded successfully | The Double-Take Availability source module was loaded successfully. |
| 51502 | Source module already loaded | The Double-Take Availability source module was already loaded. |
| 51503 | Source module stopped | The Double-Take Availability source module stopped. |
| 52000 |
|
The target has been paused or resumed through user intervention. |
| 52000 | Unfinished Op error |
This error message contains various Microsoft API codes. The text Code -<x> Internal <y> appears at the end of this message. The code value indicates why the operation failed, and the internal value indicates the type of operation that failed. The most common code values that appear in this error message are:
|
| 52501 | Target module loaded successfully | The Double-Take Availability target module was loaded successfully. |
| 52502 | Target module already loaded | The Double-Take Availability target module was already loaded. |
| 52503 | Target module stopped | The Double-Take Availability target module stopped. |
| 53001 | File was missing from target | The verification process confirms that the files on the target are identical to the files on the source. This message would only appear if the verification process showed that a file on the source was missing from the target. |
| 53003 | Could not read filename | Double-Take Availability could not read a file on the source machine because the file may have been renamed or deleted. For example, temporary files show up in queue but do not show up during transmission. (No user action required.) |
| 54000 | Kernel started | The Double-Take service was started. |
| 54001 | Failover module failed to load | The Double-Take Availability failover module failed to load. Look at previous log messages to determine the reason. |
| 54503 | Failover module stopped | The Double-Take Availability failover module stopped. |
| 99001 | Starting source module low memory processing | The source’s queue is full, and the auto-disconnect process will disconnect the source and target connection. The auto-reconnect process will automatically reestablish the connection if the auto-reconnect feature is enabled. If the auto-reconnect feature is not enabled, you must first verify that the connection between the source and target has been broken, and then manually reestablish the connection in the Replication Console. |
| 99999 | Application is terminating normally | The Double-Take service is shutting down normally. |
| 503010 | Asyncloctl for status thread 178 terminated, terminating the status thread | A Double-Take Availability process monitors the state of the Double-Take Availability driver. When the service is shut down, the driver is shut down, and this process is terminated. (No user action required.) |
| 600002 |
|
|
| 700000 | The source machine source_machine is not responding to a ping. | This occurs when all monitored IP addresses on the source machine stop responding to pings. Countdown to failover will begin at the first occurrence and will continue until the source machine responds or until failover occurs. |
| 800000 |
|
|
An event is a significant occurrence in the system or in an application that requires administrators to be notified. The operating system writes notifications for these events to a log that can be displayed using the Windows Event Viewer. Three different log files are generated: application, security, and system.
| Note: | For additional information on customizing the Event Viewer (such as sorting the display, filtering the display, and so on), see your Windows reference guide or the Windows online help. |
For a complete list of Double-Take events, see Event messages.
The following table identifies the Double-Take Availability events.
| ID | Category | Severity | Event Message | Required Response |
|---|---|---|---|---|
| 1 | Activation Key | Error | This evaluation period has expired. Mirroring and replication have been stopped. To obtain a license, please contact your vendor. | Contact your vendor to purchase either a single or site license. |
| 2 | Activation Key | Info. | The evaluation period expires in %1 day(s). | Contact your vendor before the evaluation period expires to purchase either a single or site license. |
| 3 | Activation Key | Info. | The evaluation period has been activated and expires in %1 day(s). | Contact your vendor before the evaluation period expires to purchase either a single or site license. |
| 4 | Activation Key | Warning | Duplicate activation codes detected on machine %1 from machine %2. | If you have an evaluation license or a site license, no action is necessary. If you have a single license, you must purchase either another single license or a site license. |
| 5 | Activation Key | Error | This product edition can only be run on Windows Server or Advanced Server running the Server Appliance Kit. | Verify your activation code has been entered correctly and contact technical support. |
| 1000 | DTCounters | Error | An exception occurred: %1 | Run the installation and select Repair. Contact technical support if this event occurs again. |
| 1001 | DTCounters | Error | The Double-Take counter DLL could not initialize the statistics handler object to gather performance data. | Run the installation and select Repair. Contact technical support if this event occurs again. |
| 1002 | DTCounters | Error | The Double-Take counter DLL could not map shared memory file containing the performance data. | Run the installation and select Repair. Contact technical support if this event occurs again. |
| 1003 | DTCounters | Error | The Double-Take counter DLL could not open the "Performance" key in the Double-Take section of the registry. | Run the installation and select Repair. Contact technical support if this event occurs again. |
| 1004 | DTCounters | Error | The Double-Take counter DLL could not read the "First Counter" value under the Double-Take\Performance Key. | Run the installation and select Repair. Contact technical support if this event occurs again. |
| 1005 | DTCounters | Error | The Double-Take counter DLL read the "First Help" value under the Double-Take\Performance Key. | Run the installation and select Repair. Contact technical support if this event occurs again. |
| 1006 | DTCounters | Error | The Double-Take counter DLL could not create event handler for the worker thread. | Run the installation and select Repair. Contact technical support if this event occurs again. |
| 3000 | Service | Info. | Logger service was successfully started. | No action required. |
| 3001 | Service | Info. | Logger service was successfully stopped. | No action required. |
| 4000 | Service | Info. | Kernel was successfully started. | No action required. |
| 4001 | Service | Info. | Target service was successfully started. | No action required. |
| 4002 | Service | Info. | Source service was successfully started. | No action required. |
| 4003 | Service | Info. | Source service was successfully stopped. | No action required. |
| 4004 | Service | Info. | Target service was successfully stopped. | No action required. |
| 4005 | Service | Info. | Kernel was successfully stopped. | No action required. |
| 4006 | Service | Error | Service has aborted due to the following unrecoverable error: %1 | Restart the Double-Take service. |
| 4007 | Service | Warning | Auto-disconnecting from %1 (%2) for Replication Set %3, ID: %4 due to %5 | The connection is auto-disconnecting because the disk-based queue on the source has been filled, the service has encountered an unknown file ID, the target server has restarted, or an error has occurred during disk queuing on the source or target (for example, Double-Take Availability cannot read from or write to the transaction log file). |
| 4008 | Service | Info. | Auto-disconnect has succeeded for %1 (%2) for Replication Set %3, ID: %4 | No action required. |
| 4009 | Service | Info. | Auto-reconnecting Replication Set %1 to %2 (%3) | No action required. |
| 4010 | Service | Info. | Auto-reconnect has succeeded connecting Replication Set %1 to %2 (%3) | No action required. |
| 4011 | Service | Error | Auto-reconnect has failed connecting Replication Set %1 to %2 (%3) | Manually reestablish the replication set to target connection. |
| 4012 | Service | Warning | %1 | This is a placeholder message for many other messages. See the specific log message for additional details. |
| 4013 | Service | Info. | %1 | This is a placeholder message for many other messages. See the specific log message for additional details. |
| 4014 | Service | Info. | Service has started network transmission. | No action required. |
| 4015 | Service | Info. | Service has stopped network transmission. | No action required. |
| 4016 | Service | Info. | Service has established a connection to %1 (%2) for Replication Set %3, ID: %4 | No action required. |
| 4017 | Service | Info. | Service has disconnected from %1 (%2) for Replication Set %3, ID: %4 | No action required. |
| 4018 | Service | Warning | %1, however, mirroring and replication have been disabled as a restore is required due to a previous failover. | Perform a restoration. |
| 4019 | Service | Info. | Service has started a mirror to %1 (%2) for Replication Set %3, ID: %4 | No action required. |
| 4020 | Service | Info. | Service has paused a mirror to %1 (%2) for Replication Set %3, ID: %4 | No action required. |
| 4021 | Service | Info. | Service has resumed a mirror to %1 (%2) for Replication Set %3, ID: %4 | No action required. |
| 4022 | Service | Info. | Service has stopped a mirror to %1 for Replication Set %2, ID: %3, %4 | No action required. |
| 4023 | Service | Info. | Service has completed a mirror to %1 %2 for Replication Set %3, ID: %4, %5 | No action required. |
| 4024 | Service | Info. | Service has started Replication to %1 (%2) for Replication Set %3, ID: %4 | No action required. |
| 4025 | Service | Info. | Service has stopped Replication to %1 (%2) for Replication Set %3, ID: %4 | No action required. |
| 4026 | Service | Info. | The target has been paused due to user intervention. | No action required. |
| 4027 | Service | Info. | The target has been resumed due to user intervention. | No action required. |
| 4028 | Service | Warning | Registration of service class with Active Directory failed. Verify that the Active Directory server is up and the service has the proper permissions to update its entries. | Verify that the Active Directory server is running and that the Double-Take service has permission to update Active Directory. |
| 4029 | Service | Warning | Registration of service instance with Active Directory failed. Verify that the Active Directory server is up and the service has the proper permissions to update its entries. | Verify that the Active Directory server is running and that the Double-Take service has permission to update Active Directory. |
| 4030 | Service | Error | RSResource.dll has an unknown error. The product functionality has been disabled. | Reinstall the software, using the installation Repair option, to install a new copy of the RSResource.dll. Contact technical support if this error persists. |
| 4031 | Service | Error | RSResource.dll could not be opened. The product functionality has been disabled. | Reinstall the software, using the installation Repair option, to install a new copy of the RSResource.dll. Contact technical support if this error persists. |
| 4032 | Service | Error | The RSResource.dll component version does not match the component version expected by the product. The product functionality has been disabled. | Reinstall the software, using the installation Repair option, to install a new copy of the RSResource.dll. Contact technical support if this error persists. |
| 4033 | Service | Error | RSResource.dll build version is invalid. The product functionality has been disabled. | Reinstall the software, using the installation Repair option, to install a new copy of the RSResource.dll. Contact technical support if this error persists. |
| 4034 | Service | Error | Error verifying the service name. The product functionality has been disabled. | Reinstall the software, using the installation Repair option, to install a new copy of the RSResource.dll. Contact technical support if this error persists. |
| 4035 | Service | Error | Error verifying the product name. The product functionality has been disabled. | Reinstall the software, using the installation Repair option, to install a new copy of the RSResource.dll. Contact technical support if this error persists. |
| 4036 | Service | Error | Error verifying the vendor name. The product functionality has been disabled. | Reinstall the software, using the installation Repair option, to install a new copy of the RSResource.dll. Contact technical support if this error persists. |
| 4037 | Service | Error | Error verifying the vendor URL name. The product functionality has been disabled. | Reinstall the software, using the installation Repair option, to install a new copy of the RSResource.dll. Contact technical support if this error persists. |
| 4038 | Service | Error | Error verifying the product code. The product functionality has been disabled. | Reinstall the software, using the installation Repair option, to install a new copy of the RSResource.dll. Contact technical support if this error persists. |
| 4039 | Service | Error | Error while reading RSResource.dll. The product functionality has been disabled. | Reinstall the software, using the installation Repair option, to install a new copy of the RSResource.dll. Contact technical support if this error persists. |
| 4040 | Service | Error | The product code is illegal for this computer hardware. The product functionality has been disabled. | Reinstall the software, using the installation Repair option, to install a new copy of the RSResource.dll. Contact technical support if this error persists. |
| 4041 | Service | Error | The product code is illegal for this operating system version. The product functionality has been disabled. | Reinstall the software, using the installation Repair option, to install a new copy of the RSResource.dll. Contact technical support if this error persists. |
| 4042 | Service | Error | The product code requires installing the Windows Server Appliance Kit. The product functionality has been disabled. | Reinstall the software, using the installation Repair option, to install a new copy of the RSResource.dll. Contact technical support if this error persists. |
| 4043 | Service | Error | This product can only be run on a limited number of processors and this server exceeds the limit. The product functionality has been disabled. | Reinstall the software, using the installation Repair option, to install a new copy of the RSResource.dll. Contact technical support if this error persists. |
| 4044 | Service | Error | An error was encountered and replication has been stopped. It is necessary to stop and restart the service to correct this error. | Contact technical support if this error persists. |
| 4045 | Service | Error | %1 value must be between 1025 and 65535. Using default of %2. | Verify that the Double-Take Availability port value you are trying to use is within the valid range. If it is not, it will automatically be reset to the default value. |
| 4046 | Service | Error | This service failed to start because of a possible port conflict. Win32 error: %1 | Verify that the Double-Take Availability ports are not conflicting with ports used by other applications. |
| 4047 | Service | Error | Could not load ZLIB DLL %1. Some levels of compression will not be available. | The compression levels available depend on your operating system. You can reinstall the software, using the installation Repair option, to install a new copy of the DynaZip.dll, or contact technical support if this error persists. |
| 4048 | Service | Info. | Service has started a delete orphans task to %1 (%2) for Replication Set %3, ID: %4 | No action required. |
| 4049 | Service | Info. | Service has paused a delete orphans task to %1 (%2) for Replication Set %3, ID: %4 | No action required. |
| 4050 | Service | Info. | Service has resumed a delete orphans task to %1 (%2) for Replication Set %3, ID: %4 | No action required. |
| 4051 | Service | Info. | Service has stopped a delete orphans task to %1 (%2) for Replication Set %3, ID: %4 | No action required. |
| 4052 | Service | Info. | Service has completed a delete orphans task to %1 (%2) for Replication Set %3, ID: %4 | No action required. |
| 4053 | Service | Info. | Service has started a restore task to %1 (%2) for Replication Set %3, ID: %4 | No action required. |
| 4054 | Service | Info. | Service has paused a restore task to %1 (%2) for Replication Set %3, ID: %4 | No action required. |
| 4055 | Service | Info. | Service has resumed a restore task to %1 (%2) for Replication Set %3, ID: %4 | No action required. |
| 4056 | Service | Info. | Service has stopped a restore task to %1 (%2) for Replication Set %3, ID: %4 | No action required. |
| 4057 | Service | Info. | Service has completed a restore task to %1 (%2) for Replication Set %3, ID: %4 | No action required. |
| 4058 | Service | Info. | Service has started a verification task to %1 (%2) for Replication Set %3, ID: %4 | No action required. |
| 4059 | Service | Info. | Service has paused a verification task to %1 (%2) for Replication Set %3, ID: %4 | No action required. |
| 4060 | Service | Info. | Service has resumed a verification task to %1 (%2) for Replication Set %3, ID: %4 | No action required. |
| 4061 | Service | Info. | Service has stopped a verification task to %1 (%2) for Replication Set %3, ID: %4 | No action required. |
| 4062 | Service | Info. | Service has completed a verification task to %1 (%2) for Replication Set %3, ID: %4 | No action required. |
| 4063 | Service | Info. | Bandwidth limit to %1 (%2) has changed to %3. | No action required. |
| 4064 | Service | Info. | Bandwidth limit to %1 (%2) is now in the "%3" period at %4. | No action required. |
| 4065 | Service | Warning | Target data state for connection %1 from %2 (%3) has changed because %4. | No action required. |
| 4066 | Service | Error | The product code requires a virtual server environment. The product functionality has been disabled. | The activation code you are using is for the Virtual SystemsTM edition. This code will not work on non-virtual server environments. |
| 4067 | Service | Error | No replication ops have been received from the driver for an extended period of time. | Check other messages for errors with the Double-Take Availability drivers, and correct as required. If there are no driver messages, verify that your drives are connected to the source. If this error persists, contact technical support. |
| 4068 | Service | Error | Failed to write to a replicating volume. | Reboot the source server. Contact technical support if this event occurs again. |
| 4069 | Service | Warning | The option MoveOrphansDir has been updated because it was missing or empty. | No action required. |
| 4070 | Service | Error | An error occurred while reading data for connection %1. All data needs to be remirrored. See the log for details. | Double-Take Availability will automatically remirror the data. See the Double-Take Availability log file for details. |
| 4096 | System | Warning | The registry parameter %2 is unknown. | Delete the parameter and report this issue to technical support. |
| 4097 | System | Warning | Failed to initialize WMI support. The last Word in the Data Window is the NT status code. | No action required. |
| 4097 | System | Error | The file system filter failed to load. Replication will not occur. Reboot your server and contact technical support if this error occurs again. The last Word in the Data window is the NT status code. | Reboot your server and contact technical support if this event occurs again. |
| 4098 | System | Warning | The registry parameters failed to load, so the default configuration values will be used. The last Word in the Data window is the NT status code. | No action required. |
| 4098 | System | Error | The control device %2 was not created. Communication with the service will be disabled. Reboot the server and contact technical support if this error occurs again. The last Word in the Data window is the NT status code. | Reboot your server and contact technical support if this event occurs again. |
| 4099 | System | Warning | The driver detected a hard link for a file on drive %2. Hard links are not supported. Changes to this file will not be replicated. | Hard links are not supported. |
| 4099 | System | Error | The driver failed to register with filter manager. Reboot the server and contact technical support if this error occurs again. The last Word in the Data window is the NT status code. | Reboot your server and contact technical support if this event occurs again. |
| 4100 | Activation Key | Error | Product activation code is invalid. Please check that it is typed correctly and is valid for the version of the operating system in use. | If you are in the process of installing Double-Take Availability, verify that you are using a 24 character alpha-numeric code. If Double-Take Availability is already installed, confirm that the code entered is correct. If the code appears to be correct, contact technical support. |
| 4100 | System | Error | The versions of the driver and the filter driver do not match. Replication will not occur. Reboot your server. If this error occurs again, reinstall the software. Contact technical support if this error occurs after the software has been reinstalled. The last three Words in the Data window are the NT status code and the driver version numbers. | Reboot your server. Reinstall the software if this event occurs again. Contact technical support if this event occurs after reinstalling the software. |
| 4101 | Activation Key | Error | This service will not run on this device. Contact your sales representative for upgrade procedures. | The activation code does not match the type of server you are attempting to run on. Contact your vendor for a new activation code or contact technical support. |
| 4110 | Service | Warning | Target cannot write %1 due to target disk being full. Operation will be retried (%2 times or forever) | The disk on the target is full. The operation will be retried according to the TGExecutionRetryLimit setting. |
| 4111 | Service | Warning | Target can not write %1 due to a sharing violation. Operation will be retried (%2 times or forever) | A sharing violation error is prohibiting Double-Take Availability from writing on the target. The operation will be retried according to the TGExecutionRetryLimit setting. |
| 4112 | Service | Warning | Target can not write %1 due to access denied. Operation will be retried (%2 times or forever) | An access denied error is prohibiting Double-Take Availability from writing on the target. The operation will be retried according to the TGExecutionRetryLimit setting. |
| 4113 | Service | Warning | Target can not write %1 due to an unknown reason. Operation will be retried (%2 times or forever). Please check the log files for further information on the error. | An unknown error is prohibiting Double-Take Availability from writing on the target. The operation will be retried according to the TGExecutionRetryLimit setting. |
| 4120 | Service | Info. | Target write to %1 was completed successfully after %2 retries. | No action required. |
| 4150 | Service | Error | Target write %1 failed after %2 retries and will be discarded. See the event log or log files for error conditions. After correcting the problem, you should re-mirror or run a verify to resynchronize the changes. | The operation has been retried according to the TGExecutionRetryLimit setting but was not able to be written to the target and the operation was discarded. Correct the problem and remirror the files. |
| 4155 | Service | Warning | The service was unable to complete a file system operation in the allotted time. See the log files for error conditions. After correcting the problem, remirror or perform a verification with remirror to synchronize the changes. | Correct the file system error and then remirror or perform a verification with remirror to synchronize the changes. |
| 4200 | Service | Info. | In band task %1 submitted from %2 by %3 at %4 | No action required. |
| 4201 | Service | Warning | In band task %1 discarded (submitted from %2 by %3 at %4) | A task may be discarded in the following scenarios: all connections to a target are manually disconnected, replication is stopped for all connections to a target, or an auto-disconnect occurs. If one of these scenarios did not cause the task to be discarded, contact technical support. |
| 4202 | Service | Info. | Running %1 in band script: %2 (task %3 submitted from %4 by %5 at %6) | No action required. |
| 4203 | Service | Info. | Completed run of in band script: %1 (exit code %2) | No action required. |
| 4204 | Service | Error | Error running in band script: %1 | Review the task and its associated script(s) for syntax errors. |
| 4205 | Service | Warning | Timeout (%1 seconds) running in band script: %2 | The timeout specified for the script to complete has expired. Normal processing will continue. You may need to manually terminate the script if it will never complete. |
| 4206 | Service | Warning | Run timeout disabled for in band script: %1 | The timeout period was set to zero (0). Double-Take Availability will not wait for the script to complete before continuing. No action is required. |
| 4207 | Service | Warning | In band scripts disabled by server - no attempt will be made to run %1 | Enable task command processing. |
| 4300 | Service | Error | A connection request was received on the target before the persistent target paths could be loaded. | You may need to disconnect and reconnect your replication set. |
| 4301 | Service | Error | Unable to block target paths, the driver is unavailable. | If you need to block your target paths, contact technical support. |
| 4302 | Service | Info. | Target Path %1 has been successfully blocked | No action required. |
| 4303 | Service | Warning | Blocking of target path: %1 failed. Error Code: %2 | If you need to block your target paths, contact technical support. |
| 4304 | Service | Info. | Target Path %1 has been successfully unblocked | No action required. |
| 4305 | Service | Warning | Unblocking of target path: %1 failed. Error Code: %2 | If you need to unblock your target paths, contact technical support. |
| 4306 | Service | Warning | Target paths for source %1 (%2) Connection id: %3 are already blocked | No action required. |
| 4307 | Service | Warning | Target paths for source %1 (%2) Connection id: %3 are already unblocked | No action required. |
| 4308 | Service | Error | Error loading target paths for blocking, registry key %1 has been corrupted. | If you need to block your target paths, contact technical support. |
| 4400 | Service | Error | Failed to create snapshot set for source %1 (%2) Connection ID: %3. Error: %4 | The snapshot could not be created. This may be due to a lack of disk space or memory or another reason. The error code is the Microsoft VSS error. Check your VSS documentation or contact technical support. |
| 4401 | Service | Error | Failed to delete automatic snapshot set for source %1 (%2) Connection ID: %3. Error: %4 | The automatic snapshot could not be deleted. This may be due to a lack of memory, the file does not exist, or another reason. The error code is the Microsoft Volume Shadow Copy error. Check your Volume Shadow Copy documentation or contact technical support. |
| 4402 | Service | Error | Failed to delete snapshot set for source %1 (%2) Connection ID: %3. Error: %4 | The snapshot could not be deleted. This may be due to a lack of memory, the file does not exist, or another reason. The error code is the Microsoft Volume Shadow Copy error. Check your Volume Shadow Copy documentation or contact technical support. |
| 4403 | Service | Error | A scheduled snapshot could not be created for source %1 (%2) Connection ID: %3. because the target data was in a bad state. A snapshot will automatically be created when the target data reaches a good state. | No action required. A snapshot will automatically be created when the target data reaches a good state. |
| 4404 | Service | Info. | Set snapshot schedule for source %1 (%2) connection %3 to every %4 minutes. Next snapshot: %5. | No action required. |
| 4405 | Service | Info. | Removed snapshot schedule for source %1 (%2) connection %3. | No action required. |
| 4406 | Service | Info. | Enabled snapshot schedule for source %1 (%2) connection %3. | No action required. |
| 4407 | Service | Info. | Disabled snapshot schedule for source %1 (%2) connection %3. | No action required. |
| 4408 | Service | Warning | %1 was unable to move some orphans for source %2 on connection ID %3. Check the %1 logs for further details. | Orphan files could not be moved. For example, the location could be out of disk space. Check the Double-Take Availability log for more information. |
| 4409 | Service | Warning | %3 was unable to delete some orphans for source %1 on connection ID %2. Check the %3 logs for further details. | Orphan files could not be deleted. Check the Double-Take Availability log for more information. |
| 4410 | Service | Error | The registry hive dump failed with an of error: %1. | Contact technical support. |
| 4411 | Service | Warning | The Service has detected that port %1 is being %2 by the Windows Firewall. | The firewall port needs to be unblocked or restrictions against Double-Take Availability removed so that Double-Take Availability data can be transmitted. |
| 5000 | Service | Info. | Server Monitor service was successfully started. | No action required. |
| 5001 | Service | Info. | Server Monitor service was successfully stopped. | No action required. |
| 5002 | Service | Info. | Placeholders were modified to %1. | No action required. |
| 5100 | Failover | Info. | Failover completed for %1. | No action required. |
| 5101 | Failover | Info. | IP address %1 with subnet mask %2 was added to target machine's %3 adapter. | No action required. |
| 5102 | Failover | Warning | %1 has reached a failover condition. A response from the user is required before failover can take place. | User intervention has been configured. Open the Failover Control Center and accept or decline the failover prompt. |
| 5103 | Failover | Info. | Started adding drive shares from %1 to %2. | No action required. |
| 5104 | Failover | Info. | %1 drive shares were taken over by %2. | No action required. |
| 5105 | Failover | Info. | Attempting to run the %1 script. | No action required. |
| 5106 | Failover | Info. | The %1 script ran successfully. | No action required. |
| 5107 | Failover | Error | Error occurred in running %1 script. | Verify that the script identified exists with the proper permissions. |
| 5108 | Failover | Error | The source machine %1 is not responding to a ping. | This occurs when all monitored IP addresses on the source machine stop responding to pings. Countdown to failover will begin at the first occurrence and will continue until the source machine responds or until failover occurs. |
| 5109 | Failover | Error | The public NIC on source machine %1 is not responding to a ping. | The failover target did not receive an answer to its ping of the source machine. Eventually, a failover will result. Investigate possible errors (down server, network error, etc.). |
| 5110 | Failover | Info. | The %1 script "%2" is still running. | No action required. |
| 5200 | Failback | Info.. | Failback completed for %1. | No action required. |
| 5201 | Failback | Info.. | IP address %1 was removed from target machine's %2 adapter. | No action required. |
| 5202 | Failback | Error | Unable to Failback properly because IP address %1 was missing a corresponding SubNet Mask. | Contact technical support. |
| 5300 | Monitoring | Info. | The following IP address was added to target's monitoring list: %1 | No action required. |
| 5301 | Monitoring | Info. | The following IP address was removed from target's monitoring list: %1 | No action required. |
| 5302 | Monitoring | Info. | Drive share information for %1 has been updated on the target machine. | No action required. |
| 5303 | Monitoring | Info. | The application monitor script has started successfully. | No action required. |
| 5304 | Monitoring | Info | The application monitor script has finished successfully. | No action required. |
| 5305 | Monitoring | Warning | The application monitor has found the %1 service stopped. | Double-Take Availability Application Manager will attempt to restart the service. |
| 5306 | Monitoring | Warning | The application monitor has restarted the %1 service. | No action required. |
| 5307 | Monitoring | Error | The application monitor cannot contact the server %1. | Verify the server is running. Verify available network communications with the server. |
| 5400 | ARP | Info. | Broadcasted new MAC address %1 for IP address %2. | No action required. |
| 5500 | Service | Warning | Could not connect to e-mail server. Check to make sure the SMTP server %1 is available (error code: %2). | Double-Take Availability could not connect to your SMTP server or the username and/or password supplied is incorrect. Verify that SMTP server is available and that you have identified it correctly in your e-mail notification configuration. Also verify that your username and password have been entered correctly. |
| 5501 | Service | Warning | E-mail notification could not be enabled (error code: %1). | This alert occurs if there is an unexpected error enabling e-mail notification during service startup. Check to see if any other errors related to e-mail notification have been logged. Also, check to make sure the Windows Management Instrumentation (WMI) service is enabled. If neither of these apply, contact technical support. |
| 5502 | Service | Warning | E-mail notification could not be initialized. Check to make sure Internet Explorer 5.0 or later is installed. | E-mail notification no longer requires Internet Explorer 5.0 or later. If you receive this error, contact technical support. |
| 5503 | Service | Warning | E-mail notification could not be processed. Check to make sure the correct version of SMTPMail.DLL is registered on the system (error code: %1). | If you are using Double-Take Availability 4.4.2.1 or earlier and Windows NT 4.0, e-mail notification requires Windows Management Instrumentation (WMI) to be installed. Verify that you have it installed on the Double-Take Availability server. |
| 5504 | Service | Warning | Could not load LocalRS.dll (for e-mail notification). | This alert occurs if there is an error loading the resource DLL for the service. Typically, this is caused by a missing LocalRS.dll file. Reinstall the software, using the installation Repair option, to install a new copy of the LocalRS.dll. Contact technical support if this error persists. |
| 5505 | Service | Warning | E-mail could not be sent. Check e-mail settings (error code: %1). | Verify that the e-mail server that you have identified in your e-mail notification configuration is correct. |
| 5506 | Service | Warning | One or more required e-mail settings have not been specified (error code: %1). | At a minimum, you must specify the e-mail server, the From and To addresses, and at least one type of event to include. |
| 5507 | Service | Warning | E-mail notification could not be initialized. Check to make sure WMI is installed and available (error code: %1). | If you are using Double-Take Availability 4.4.2.1 or earlier and Windows NT 4.0, e-mail notification requires Windows Management Instrumentation (WMI) to be installed. Verify that you have it installed on the Double-Take Availability server. |
| 5508 | Service | Warning | An error occurred connecting to the WMI namespace. Check to make sure the Windows Management Instrumentation service is not disabled (error code %1). | This alert occurs if there is an error with the Windows Management Instrumentation (WMI) service. Verify that you have it installed on the Double-Take Availability server and that it is enabled. |
| 5600 | Service | Warning | Part or all of the e-mail setting %1 is not in a valid format. | Verify that the include categories and exclude ID list are identified and formatted correctly. |
| 7106 | RepDrv | Error | The driver was unable to get valid name information from the Filter Manager for the file %2. (Filename may be truncated.) It cannot be replicated. Please contact technical support. | Contact technical support. |
| 7107 | RepDrv | Error | The driver was unable to get valid name information from the Filter Manager for a file. It cannot be replicated. Please contact technical support. | Contact technical support. |
| 8100 | RepDac | Error | The driver encountered an unrecoverable internal error. Contact technical support. The last Word in the Data window is the internal error code. | Contact technical support. |
| 8192 | Resources | Error | Driver failed to allocate Kernel memory. Replication is stopped and server must be rebooted for replication to continue. The last word in the data window is the tag of the allocation that failed. | Reboot the server and contact technical support if this event occurs again. |
| 8192 | RepDrv | Error | Kernel memory is exhausted. Replication is stopped. This may have been caused by low system resources. | Reboot the server and contact technical support if this event occurs again. |
| 8193 | System | Error | The driver failed to create a thread required for normal operation. This may have been caused by low system resources. Reboot your server and contact technical support if this error occurs again. The last Word in the Data window is the NT status code. | Reboot the server and contact technical support if this event occurs again. |
| 8196 | RepDrv | Warning | The maximum amount of memory for replication queuing has been reached. Replication is stopped and memory is being freed. | Contact technical support if this event occurs again. |
| 8198 | Resources | Warning | The driver registry path could not be saved. The default registry path will be used. | No action required. |
| 8200 | Resources | Warning | The driver failed to allocate a buffer for a file name longer than 260 characters. The file will be skipped. The last Word in the Data window is the NT status code. | Reboot the server and contact technical support if this event occurs again. |
| 9000 | RepKap | Warning | The driver has failed to process a rename operation. The driver will resend the rename operation. This message is only a warning. If you receive this message repeatedly, contact technical support. The last Word in the Data window is the NT status code. | Contact technical support if this event occurs again. |
| 9100 | RepKap | Error | The driver encountered an error opening a file from the service. Check the Event Viewer Application log for additional service information or contact technical support. The last Word in the Data window is the exception code. | Check for related service messages. Contact technical support if this event occurs again. |
| 9101 | RepKap | Error | The driver encountered an error reading from the service input buffer. Check the Event Viewer Application log for additional service information or contact technical support. The last Word in the Data window is the exception code. | Check for related service messages. Contact technical support if this event occurs again. |
| 9102 | RepKap | Error | The driver encountered an error writing to the service output buffer. Check the Event Viewer Application log for additional service information or contact technical support. The last Word in the Data window is the exception code. | Check for related service messages. Contact technical support if this event occurs again. |
| 9103 | RepKap | Error | The driver encountered an error writing to the service input buffer. Check the Event Viewer Application log for additional service information or contact technical support. The last Word in the Data window is the exception code. | Check for related service messages. Contact technical support if this event occurs again. |
| 9104 | RepKap | Error | The driver encountered an error querying for file security from the service input buffer. Check the Event Viewer Application log for additional service information or contact technical support. The last Word in the Data window is the exception code. | Check for related service messages. Contact technical support if this event occurs again. |
| 9105 | RepKap | Error | The driver encountered an error querying for file security from the service input buffer. Check the Event Viewer Application log for additional service information or contact technical support. The last Word in the Data window is the exception code. | Check for related service messages. Contact technical support if this event occurs again. |
| 9106 | RepKap | Error | The driver encountered an error writing file security data to the service input buffer. Check the Event Viewer Application log for additional service information or contact technical support. The last Word in the Data window is the exception code. | Check for related service messages. Contact technical support if this event occurs again. |
| 9107 | RepKap | Error | The driver encountered an error querying for an allocated range from the service input buffer. Check the Event Viewer Application log for additional service information or contact technical support. The last Word in the Data window is the exception code. | Check for related service messages. Contact technical support if this event occurs again. |
| 9108 | RepKap | Error | The driver encountered an error querying for an allocated range from the service output buffer. Check the Event Viewer Application log for additional service information or contact technical support. The last Word in the Data window is the exception code. | Check for related service messages. Contact technical support if this event occurs again. |
| 9109 | RepKap | Error | The driver encountered an error writing an allocated range to the service input buffer. Check the Event Viewer Application log for additional service information or contact technical support. The last Word in the Data window is the exception code. | Check for related service messages. Contact technical support if this event occurs again. |
| 9110 | RepKap | Error | The driver encountered an error querying for a directory from the service input buffer. Check the Event Viewer Application log for additional service information or contact technical support. The last Word in the Data window is the exception code. | Check for related service messages. Contact technical support if this event occurs again. |
| 9111 | RepKap | Error | The driver encountered an error querying for a directory from the service output buffer. Check the Event Viewer Application log for additional service information or contact technical support. The last Word in the Data window is the exception code. | Check for related service messages. Contact technical support if this event occurs again. |
| 9112 | RepKap | Error | The driver encountered an error writing a directory query to the service input buffer. Check the Event Viewer Application log for additional service information or contact technical support. The last Word in the Data window is the exception code. | Check for related service messages. Contact technical support if this event occurs again. |
| 9113 | RepKap | Error | The driver encountered an error querying a stream from the service input buffer. Check the Event Viewer Application log for additional service information or contact technical support. The last Word in the Data window is the exception code. | Check for related service messages. Contact technical support if this event occurs again. |
| 9114 | RepKap | Error | The driver encountered an error writing a stream query to the service output buffer. Check the Event Viewer Application log for additional service information or contact technical support. The last Word in the Data window is the exception code. | Check for related service messages. Contact technical support if this event occurs again. |
| 9115 | RepKap | Error | The driver encountered an error writing a stream query to the service output buffer. Check the Event Viewer Application log for additional service information or contact technical support. The last Word in the Data window is the exception code. | Check for related service messages. Contact technical support if this event occurs again. |
| 9116 | RepKap | Error | The driver has failed to close a file handle. If you receive this message repeatedly, contact technical support. The last Word in the Data window is the NT status code. | Contact technical support. |
| 9117 | RepKap | Error | The driver encountered an error querying for extended attributes from the service input buffer. Check the Event Viewer Application log for additional service information or contact technical support. The last Word in the Data window is the exception code. | Check for related service messages. Contact technical support if this event occurs again. |
| 9118 | RepKap | Error | The driver encountered an error writing extended attributes to the service output buffer. Check the Event Viewer Application log for additional service information or contact technical support. The last Word in the Data window is the exception code. | Check for related service messages. Contact technical support if this event occurs again. |
| 9119 | RepKap | Error | The driver encountered an error writing extended attributes status to the service input buffer. Check the Event Viewer Application log for additional service information or contact technical support. The last Word in the Data window is the exception code. | Check for related service messages. Contact technical support if this event occurs again. |
| 9120 | RepKap | Error | The driver encountered an error querying for file information from the service input buffer. Check the Event Viewer Application log for additional service information or contact technical support. The last Word in the Data window is the exception code. | Check for related service messages. Contact technical support if this event occurs again. |
| 9121 | RepKap | Error | The driver encountered an error writing file information to the service output buffer. Check the Event Viewer Application log for additional service information or contact technical support. The last Word in the Data window is the exception code. | Check for related service messages. Contact technical support if this event occurs again. |
| 9122 | RepKap | Error | The driver encountered an error writing file information status to the service input buffer. Check the Event Viewer Application log for additional service information or contact technical support. The last Word in the Data window is the exception code. | Check for related service messages. Contact technical support if this event occurs again. |
| 9123 | RepKap | Error | The driver encountered an error querying for fsctl information from the service input buffer. Check the Event Viewer Application log for additional service information or contact technical support. The last Word in the Data window is the exception code. | Check for related service messages. Contact technical support if this event occurs again. |
| 9124 | RepKap | Error | The driver encountered an error writing fsctl information to the service output buffer. Check the Event Viewer Application log for additional service information or contact technical support. The last Word in the Data window is the exception code. | Check for related service messages. Contact technical support if this event occurs again. |
| 9125 | RepKap | Error | The driver encountered an error writing fsctl status to the service input buffer. Check the Event Viewer Application log for additional service information or contact technical support. The last Word in the Data window is the exception code. | Check for related service messages. Contact technical support if this event occurs again. |
| 10000 | RepHsm | Warning | This message is only a placeholder warning. The last Word in the Data window is the NT status code. | No action required. |
| 10000 | GeoCluster | Error | Connect failed to node %1 for resource %2. Adding node to reconnect list. | Ensure that GeoCluster is running on all possible owners and that it can communicate on the network selected for mirroring and replication traffic. GeoCluster will try to reestablish a connection using the check unresponsive node interval specified for the resource. |
| 10001 | GeoCluster | Info. | Reconnect succeeded to node %1 for resource %2. Will be added as a possible owner when mirror is complete. | No action required. |
| 10002 | GeoCluster | Error | Disk check failed on node %1 for resource %2. Removing as a possible owner. | Ensure that GeoCluster is running on all possible owners and that it can communicate on the public network. Also ensure that the disk specified for the resource is functioning correctly on all possible owners. |
| 10003 | GeoCluster | Error | Owner %1 of the quorum resource %2 couldn't access the arbitration path %3. Network may be down. | Ensure that the network used to access the arbitration path is up and that the server is operational. Also ensure that the arbitration share path does exist and that the account running the cluster service has write privileges to the share path. |
| 10004 | GeoCluster | Warning | Failover of the group %1 is being delayed. Group will be brought online when the target queue is below the limit or the timeout has expired. | No action required. |
| 10005 | GeoCluster | Info. | Node %1 is taking ownership of the group %2. The group will be brought online on this node. | No action required. |
| 10006 | GeoCluster | Warning | The cluster notification thread failed to start on node %1 for resource %2. The resource should be taken offline and brought back online. | Take the resource offline and bring it back online. |
| 10007 | GeoCluster | Warning | The user %1 has reverted a snapshot for the %2 resource on node %3. | No action required. The snapshot you selected will be reverted. |
| 10008 | GeoCluster | Warning | The user %1 has discarded queued data for the %2 resource on node %3. | No action required. The queue you selected will be discarded. |
| 10009 | GeoCluster | Warning | The user %1 is verifying data for the %2 resource on node %3. | A snapshot of the current data has been taken. After you have verified the data, accept or reject the data. |
| 10010 | GeoCluster | Warning | The user %1 has rejected the data for the %2 resource on node %3. | No action required. Since the data was rejected, the data has been reverted to the snapshot taken when the data was selected for verification. |
| 10011 | GeoCluster | Warning | The user %1 has accepted the data for the %2 resource on node %3. | No action required. The current data will be used. |
| 10012 | GeoCluster | Warning | The GeoCluster Replicated Disk resource %1 has been set to validate its data. No data replication is occurring to the remaining nodes in the cluster. Please Accept or Reject the data by right-clicking on the resource and selecting the appropriate option. | Replication has been stopped because of the validation request. Accept or reject the data on the node by right-clicking on the resource and selecting the appropriate option. |
| 10100 | RepKap | Error | The driver could not recall a file because it did not have a token for impersonation. The security provider service should set this token. The last Word in the Data window is the exception code. | Contact technical support if this event occurs again. |
| 10101 | RepKap | Error | The driver could not access the file in the archive bin, due to a failed impersonation attempt. The last Word in the Data window is the exception code. | Contact technical support if this event occurs again. |
| 10102 | RepKap | Error | The driver could not recall the file. The last Word in the Data window is the exception code. | Contact technical support if this event occurs again. |
| 11000 | Service | Info. | Service has started an archive to %1 (%2) for Replication Set %3, ID: %4 | No action required. |
| 11001 | Service | Info. | Service has completed an archive to %1 (%2) for Replication Set %3, ID: %4, %5 | No action required. |
| 11002 | Service | Info. | Service has started a recall from %1 (%2) for Replication Set %3, ID: %4 | No action required. |
| 11003 | Service | Info. | Service has completed a recall from %1 (%2) for Replication Set %3, ID: %4, %5 | No action required. |
| 11004 | Service | Warning | Service has failed connection to the RepHSM driver. %1 | Reboot the server or manually restart the RepHSM.sys driver. |
| 11005 | Service | Warning | Service has aborted the archive operation. | Verify the activation code on the source and target is valid for archiving. Reboot an unlicensed server. |
| 11006 | Service | Warning | Service has aborted the archive recall operation. | Verify the activation code on the source and target is valid for archiving. Reboot an unlicensed server. |
| 11007 | Service | Warning | Verification has finished with errors. %1 | Review the verification log to correct or accept the errors. |
| 11008 | Service | Warning | Archive feature is not supported on volume %1 | The source and target must be NTFS for archiving functionality |
| 11009 | Service | Info. | Service has started an archive preview to %1 (%2) for Replication Set %3, ID: %4 | No action required. |
| 11010 | Service | Info. | Service has completed an archive preview to %1 (%2) for Replication Set %3, ID: %4 | No action required. |
| 11011 | Service | Warning | Service has aborted the archive preview operation. | Verify the activation code on the source and target is valid for archiving. Reboot an unlicensed server. |
| 12000 | DTRecall | Info. | The service has started. | This message refers to the Double-Take Recall service. No action required. |
| 12001 | DTRecall | Error | The service failed to start. | Check the user name and password for the Double-Take Recall service to ensure validity. Reinstall the software if this event occurs again. |
| 12002 | DTRecall | Info. | The service has stopped. | This message indicates a system shutdown or the user stopped the Double-Take Recall service. No action is required. |
| 12003 | DTRecall | Error | The service failed to create a stop control event. (Error %1) | Restart the Double-Take Recall service. Reinstall the software if this event occurs again. |
| 12004 | DTRecall | Error | RegisterServiceCtrlHandler failed. (Error %1) | Restart the Double-Take Recall service. Reinstall the software if this event occurs again. |
| 12005 | DTRecall | Error | Service encountered SetServiceStatus error (Error %1) | Restart the Double-Take Recall service. Reinstall the software if this event occurs again. |
| 12006 | DTRecall | Error | Service could not get handle to driver for security update. (Error %1) | The Double-Take Recall service could not connect to the Double-Take Recall archiving driver. Reboot the server and reinstall the software if this event occurs again. |
| 12007 | DTRecall | Warning | Service failed a periodic security update. (Error %1) | This message refers to the Double-Take Recall service. The operation will be performed every five minutes. Reinstall the software if this event occurs after five minutes. |
| 12288 | RepDrv | Error | The driver encountered an error accessing a buffer from the service. Contact technical support. The last Word in the Data window is the exception code. | Contact technical support. |
| 16384 | RepDrv | Error | The driver encountered an unrecoverable error. Contact technical support. | Contact technical support |
| 16385 | RepDrv | Error | The driver encountered an unexpected internal result. Contact technical support. The last Word in the Data window is the NT status code. | Contact technical support. |
| 16393 | RepDrv | Error | The driver encountered an internal error. Contact technical support. The last Word in the Data window is the internal error code. | Contact technical support. |
| 16395 | Resources | Error | The driver detected a memory error which may have been caused by a bad driver or faulty hardware. Contact technical support. The last Word in the Data window is the internal error code. | Contact technical support. |
| 16396 | Resources | Error | The driver failed to create work queues for normal operation. This may have been caused by low system resources. Reboot the server and contact technical support if this error occurs again. The last Word in the Data window is the NT status code. | Reboot the server and contact technical support if this event occurs again. |
| 16400 | RepDrv | Info. | RepDrv has encountered an unexpected condition, usually caused by low kernel memory. Unless otherwise mentioned, this event has already been handled and your data remains protected. If you continue to receive these events or have further questions please contact tech support. | No action required. |
You can e-mail Double-Take Availability event messages to specific addresses. The subject of the e-mail will contain an optional prefix, the server name where the message was logged, the message ID, and the severity level (information, warning, or error). The text of the message will be displayed in the body of the e-mail message.
| Note: | Any specified notification settings are retained when Enable notification is disabled. |
If desired, enter unique text for the Subject Prefix which will be inserted at the front of the subject line for each Double-Take Availability e-mail message. This will help distinguish Double-Take Availability messages from other messages. This field is optional.
If desired, enable Add event description to subject to have the description of the message appended to the end of the subject line. This field is optional.
| Note: |
You can test e-mail notification by specifying the options on the E-mail Notification tab and clicking Test. (By default, the test will be run from the machine where the Replication Console is running.) If desired, you can send the test message to a different e-mail address by selecting Send To and entering a comma or semicolon separated list of addresses. Modify the message text up to 1024 characters, if necessary. Click Send to test the e-mail notification. The results will be displayed in a message box. Click OK to close the message and click Close to return to the E-mail Notification tab. E-mail notification will not function properly if the Event logs are full. If an error occurs while sending an e-mail, a message will be generated. This message will not trigger an e-mail. Subsequent e-mail errors will not generate additional messages. When an e-mail is sent successfully, a message will then be generated. If another e-mail fails, one message will again be generated. This is a cyclical process where one message will be generated for each group of failed e-mail messages, one for each group of successful e-mail messages, one for the next group of failed messages, and so on. If you start and then immediately stop the Double-Take service, you may not get e-mail notifications for the log entries that occur during startup. By default, most virus scan software blocks unknown processes from sending traffic on port 25. You need to modify the blocking rule so that Double-Take Availability e-mail messages are not blocked. |
Statistics logging is the process of taking snapshots of Double-Take Availability statistical data. The data can be written to a file for future use. Changes to the statistics file configuration are detected and applied immediately without restarting the Double-Take service.
The statistics log file created is a binary file. To view the log file, you must run the DTStat utility from the command prompt.
|
================================= 0/11/10 12:48:05:2040 ================================= SYSTEMALLOCATOR::Total Bytes: 0 IQALLOCATOR::Total Bytes: 0 SECURITY::Logins : 1 FailedLogins : 0 KERNEL::SourceState: 2 TargetState: 1 Start Time: Tue Sep 11 12:45:26 2007 RepOpsGenerated: 436845 RepBytesGenerated: 0 MirOpsGenerated: 3316423 MirBytesGenerated: 108352749214952 FailedMirrorCount: 0 FailedRepCount: 0 ActFailCount: 0 TargetOpenHandles: 0 DriverQueuePercent: 0 TARGET:: PeerAddress: 10.10.1.104 LocalAddress: 10.10.1.104 Ops Received: 25 Mirror Ops Received: 23 Retries: 0 OpsDropped: 0 Ops Remaining: 0 Orphan Files Removed: 0 Orphan Directories Removed: 0 Orphan Bytes Removed: 0 Bytes In Target Queue: 0 Bytes In Target Disk Queue: 0 TasksSucceeded: 0 TasksFailed: 0 TasksIgnored: 0 SOURCE::autoDisConnects : 0 autoReConnects : 1 lastFileTouched : /log/data_file CONNECTION:: conPeerAddress: 10.10.1.104 connectTime: Tue Sep 11 12:45:34 2007 conState: 1 conOpsInCmdQueue: 0 conOpsInAckQueue: 0 conOpsInRepQueue: 0 conOpsInMirQueue: 0 conBytesInRepQueue: 0 conOpsTx: 27 conBytesInMirQueue: 0 conBytesTx: 14952687269 conBytesCompressedTx: 14952 conOpsRx: 201127 conBytesRx: 647062280 conResentOpCount: 0 conBytesInDiskQueue: 0 conBandwidthLimit: 429496295 conBytesSkipped: 22867624 conMirrorBytesRemain: 0 conMirrorPercent: 100.0% conTaskCmdsSubmitted: 0 conTaskCmdsQueued: 0 conTasksSucceeded: 0 conTasksFailed: 0 conTasksIgnored: 0 |
The statistics log file created is a binary file. To view the log file, you must run the DTStat utility from a command prompt. From the directory where Double-Take Availability is installed, run the DTStat command.
| Command | DTSTAT |
| Description | Starts the DTStats statistics logging utility from a command prompt |
| Syntax | DTSTAT [-p][-i <interval>][-t <filename>] [-f <filename>] [-s <filename>] [-st <filename>][-IP <address>] [-START <mm/dd/yyyy hh:mm>][-STOP <mm/dd/yyyy hh:mm>] [-SERVER <ip_address> <port_number>] |
| Options |
|
| Examples |
|
| Notes |
|
The following table identifies the Double-Take Availability statistics.
| Note: |
The categories you see will depend on the function of your server (source, target, or both). If you have multiple IP addresses connected to one target server, you will see multiple Target sections for each IP address. If you convert your statistics output to an ASCII, comma-delimited file using the dtstat -s option, keep in mind the following differences.
|
| Category | Statistic | Description |
|---|---|---|
| Date/Time Stamp | The date and time that the snapshot was taken. This is the date and time that each statistic was logged. By default, these are generated once a second, as long as there are statistics being generated. If mirroring/replication is idle, then DTStat will be idle as well. | |
| SystemAllocator | Total Bytes | The number of bytes currently allocated to the system pagefile |
| IQAllocator | Total Bytes | The number of bytes currently allocated to the intermediate queue |
| Security | Logins | The number of successful login attempts |
| FailedLogins | The number of failed login attempts | |
| Kernel | SourceState |
|
| TargetState |
|
|
| Start Time | Date and time stamp indicating when the Double-Take service was loaded | |
| RepOpsGenerated | The number of replication operations generated by the file system driver. An op is a file system operation. Double-Take Availability replicates data by sending the file system operations across the network to the target. RepOpsGenerated indicates the number of file system operations that have been generated by replication. | |
| RepBytesGenerated | The number of replication bytes generated by the file system driver. This is the number of bytes generated during replication. In other words, this is roughly the amount of traffic being sent across the network that is generated by replication. It does not take into account TCP/IP overhead (headers and such). | |
| MirOpsGenerated | The number of mirror operations transmitted to the target. Mirroring is completed by transmitting the file system operations necessary to generate the files on the target. This statistic indicates the number of file system operations that were transmitted during the initial mirror. It will continue to increase until the mirror is complete. Any subsequent remirrors will reset this field to zero and increment from there. | |
| MirBytesGenerated | The number of mirror bytes transmitted to the target. This is the number of bytes generated during mirroring. In other words, this is roughly the amount of traffic being sent across the network that is generated by the mirror. It does not take into account TCP/IP overhead (headers and such). Again, any subsequent remirror will reset this field to zero and increment from there. | |
| FailedMirrorCount | The number of mirror operations that failed due to an error reading the file from the disk | |
| FailedRepCount | The number of replication operations that failed due to an error reading the file from the disk | |
| ActFailCount | The number of activation code failures when loading the source or target. Activation codes can be bad for reasons such as: expiration of evaluation codes, duplicate codes, incorrect codes, etc. | |
| TargetOpenHandles | The number of handles currently open on the target | |
| DriverQueuePercent | The amount of throttling calculated as a percentage of the stop replicating limit | |
| Target | PeerAddress | The IP address of the source machine |
| LocalAddress | The IP address of the target machine. | |
| Ops Received | The total number of operations received by this machine as a target since the Double-Take service was loaded | |
| Mirror Ops Received | The total number of mirror operations received by this machine as a target since the Double-Take service was loaded. This number does not reset to zero for remirrors. | |
| Retries | The number of retries performed before all operations were completed | |
| OpsDropped | The number of operations skipped during a difference mirror. During a difference mirror, if Double-Take Availability detects that there have been no changes to a file, then it will indicate the number of operations it did not send for this file in this field. | |
| Ops Remaining | The total number of operations that are left in the target queue | |
| Orphan Files Removed | The number of orphan files removed from the target machine | |
| Orphan Directories Removed | The number of orphan directories removed from the target machine | |
| Orphan Bytes Removed | The number of orphan bytes removed from the target machine | |
| Bytes In Target Queue | The number of bytes currently in the system memory queue on the target | |
| Bytes In Target Disk Queue | The number of bytes currently in the disk queue on the target | |
| TasksSucceeded | The number of task commands that have succeeded on the target | |
| TasksFailed | The number of task commands that have failed on the target | |
| TasksIgnored | The number of task commands that have been ignored on the target | |
| Source | autoDisConnects | The number of automatic disconnects since starting Double-Take Availability. Auto-disconnects occur because the source no longer sees the target This could be because the connection between the two has failed at some point or because the target machine data is changing on the source faster than the source can get the data to the target. This field tracks the number of times an auto-disconnect has occurred since the Double-Take service was started. |
| autoReConnects | The number of automatic reconnects since starting Double-Take Availability. Auto-reconnect occurs after a target machine is back online. This field tracks the number of times an auto-reconnect has happened since the Double-Take service was started. | |
| lastFileTouched | The last filename that had a replication operation executed | |
| Connection
|
conPeerAddress | The IP address of the target machine |
| connectTime | The time that this connection was established | |
| conState |
The state of the active connection
Only the Scheduled and Error states can coexist. All other states are mutually exclusive. Statistics will display a conState of 12 when the connection is in both a scheduled and an error state because this is the sum of the two values (4 + 8). |
|
| conOpsInCmdQueue | The number of operations waiting to be executed on the target | |
| conOpsInAckQueue | The number of operations waiting in the acknowledgement queue. Each operation that is generated receives an acknowledgement from the target after that operation has been received by the target. This statistic indicates the number of operations that have yet to receive acknowledgement of receipt. | |
| conOpsInRepQueue | The number of replication operations currently waiting to be executed on the target | |
| conOpsInMirQueue | The number of mirror operations currently waiting to be executed on the target | |
| conBytesInRepQueue | The number of replication bytes remaining to be transmitted to the target | |
| conOpsTx | The number of operations transmitted to the target. This is the total number of operations that Double-Take Availability has transmitted as a source. In other words, the cumulative number of operations transmitted by this source to all connected targets. | |
| conBytesInMirQueue | The number of mirror bytes remaining to be transmitted to the target | |
| conBytesTx | The number of bytes transmitted to the target. This is the total number of bytes that Double-Take Availability has transmitted as a source. In other words, the cumulative number of bytes transmitted by this source to all connected targets. | |
| conBytesCompressedTx | The number of compressed bytes transmitted to the target. | |
| conOpsRx | The number of operations received by the target. The number of operations that the target for this connection (as indicated by the IP address field) has received from this source. | |
| conBytesRx | The number of bytes received by the target. The number of bytes that the target for this connection (as indicated by the IP address field) has received from this source. | |
| conResentOpCount | The number of operations resent because they were not acknowledged | |
| conBytesInDiskQueue | The number of bytes in the source disk queue | |
| conBandwidthLimit | The amount of bandwidth that may be used to transfer data | |
| conBytesSkipped | The number of bytes skipped during a difference mirror. During a difference mirror, if Double-Take Availability detects that there have been no changes to a file, then it will indicate the number of bytes it did not send for this file in this field. | |
| conMirrorBytesRemain | The number of mirror bytes remaining to be transmitted | |
| conMirrorPercent | The percentage of the mirror that has been completed. This field is determined if the replication set size was calculated. | |
| conTaskCmdsSubmitted | The number of task commands that have been submitted on the source | |
| conTaskCmdsQueued | The number of task commands that have been queued on the source | |
| conTasksSucceeded | The number of task commands that have succeeded on the source | |
| conTasksFailed | The number of task commands that have failed on the source | |
| conTasksIgnored | The number of task commands that have been ignored on the source |
Performance Monitor is the Windows graphical tool for measuring performance. It provides charting, alerting, and reporting capabilities that reflect both current activity and ongoing logging. Double-Take Availabilitystatistics are available through the Performance Monitor.
For additional information and details on the Performance Monitor, see your Windows reference guide.
The following table identifies the Double-Take Availability Performance Monitor statistics.
| Note: | If you have multiple IP addresses connected to one target server, you will see multiple Target statistic sections for each IP address. |
| Object | Statistic | Description |
|---|---|---|
| Connection | Bandwidth Limit | The amount of bandwidth that may be used to transfer data |
| Bytes in disk queue | The number of bytes in the source disk queue | |
| Bytes in replication queue | The number of replication bytes in the source queue | |
| Bytes in mirror queue | The number of mirror bytes in the source queue | |
| Bytes received | The number of bytes received by the target since the last Performance Monitor refresh | |
| Bytes transferred | The number of bytes transmitted from the source | |
| Compressed bytes transferred | The number of compressed bytes transmitted from the source | |
| Operations in acknowledgement queue | The number of operations waiting in the source acknowledgement queue | |
| Operations in command queue | The number of operations waiting in the source command queue | |
| Operations in mirror queue | The number of mirror operations in the source queue | |
| Operations in replication queue | The number of replication operations in the source queue | |
| Operations received | The number of operations received by the target since the last Performance Monitor refresh | |
| Operations resent | The number of operations re-sent since the last time the Double-Take service was restarted on the source | |
| Operations transmitted | The number of operations transmitted from the source | |
| Task commands queued | The number of task commands queued on the source | |
| Task commands submitted | The number of task commands submitted on the source | |
| Tasks failed | The number of task commands that have failed to execute on the source | |
| Tasks ignored | The number of task commands that have been ignored on the source | |
| Tasks succeeded | The number of task commands that have succeeded on the source | |
| Kernel | Activation code failures | The number of activation code failures when loading the source or target, since the last time the Double-Take service was restarted on the source |
| Double-Take queue memory usage | The amount of system memory in use by the Double-Take Availability queue | |
| Driver Queue Percent | The amount of throttling calculated as a percentage of the stop replicating limit | |
| Failed mirror operations | The number of mirror operations on the source that failed due to an error reading the file from the disk | |
| Failed replication operations | The number of replication operations on the source that failed due to an error reading the file from the disk | |
| Mirror Kbytes generated | The number of mirror kilobytes transmitted from the source | |
| Mirror operations generated | The number of mirror operations transmitted from the source | |
| Open Target Handles | The number of handles currently open on the target. | |
| Replication Kbytes generated | The number of replication kilobytes generated on the source by the file system driver | |
| Replication operations generated | The number of replication operations generated on the source by the file system driver | |
| Security | Failed logins | Number of failed login attempts since the last time the Double-Take service was restarted |
| Successful logins | Number of successful login attempts since the last time the Double-Take service was restarted | |
| Source | Auto disconnects | The number of automatic disconnects since the last time the Double-Take service was restarted on the source |
| Auto reconnects | The number of automatic reconnects since the last time the Double-Take service was restarted on the source | |
| Target | Bytes in Disk Queue | The number of bytes in the target disk queue |
| Bytes in Queue | The number of bytes in the system memory and disk queues | |
| Mirror operations received | The number of mirror operations received on the target | |
| Operations received | The number of operations received on the target | |
| Ops Dropped | The number of operations dropped on the target since the last time the Double-Take service was restarted on the target | |
| Ops Remaining | The number of operations on the target remaining to be applied | |
| Orphan Bytes | The number of orphan bytes removed from the target | |
| Orphan Directories | The number of orphan directories removed from the target | |
| Orphan Files | The number of orphan files removed from the target | |
| Retries | The number of retries performed on the target since the last time the Double-Takeservice was restarted on the target | |
| Tasks failed | The number of task commands that have failed on the target. | |
| Tasks ignored | The number of task commands that have been ignored on the target | |
| Tasks succeeded | The number of task commands that have succeeded on the target |
SNMP, Simple Network Management Protocol, is the Internet's standard for remote monitoring and management of hosts, routers and other nodes and devices on a network. Double-Take Availability provides an SNMP sub-agent that can be managed from an SNMP Management Console.
Double-Take Availability installs two components to work with SNMP.
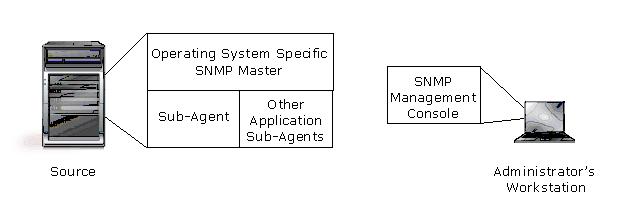
SNMP must be installed on a server before Double-Take Availability in order for the Double-Take AvailabilitySNMP components to be added during the Double-Take Availabilityinstallation. If SNMP is installed on a server after Double-Take Availability is installed, run a repair install to install the SNMP components.
The Double-Take Availability .mib file will need to be loaded into your SNMP Management Console. Depending on the type of console you are using, this process might include compiling the .mib file. Reference your SNMP Management Console documentation for additional information.
The following table lists the Double-Take Availability SNMP traps.
| Object Type | Trap | Description |
|---|---|---|
| Kernel | dttrapKernelStarted | Double-Take Availability has started |
| dttrapKernelStopped | Double-Take Availability has stopped | |
| License | dttrapLicenseViolationStartingSource | The source cannot be started due to a license violation |
| dttrapLicenseViolationOnNetwork | A Double-Take Availability serial number conflict was identified on the network | |
| Source | dttrapSourceStarted | Double-Take Availability source component has started |
| dttrapSourceStopped | Double-Take Availability source component has stopped | |
| Target | dttrapTargetStarted | Double-Take Availability target component has started |
| dttrapTargetStopped | Double-Take Availability target component has stopped | |
| Connection | dttrapConnectionRequested | The source has requested a connection to the target |
| dttrapConnectionRequestReceived | The target has received a connection request from the source | |
| dttrapConnectionSucceeded | The source to target connection has been established | |
| dttrapConnectionPause | The source to target connection has paused | |
| dttrapConnectionResume | The source to target connection has resumed | |
| dttrapConnectionFailed | The source to target connection was not successful | |
| dttrapConnectionLost | The source to target connection has been disconnected | |
| dttrapMemoryLimitReached | The Double-Take Availability memory pool limit has been reached | |
| dttrapMemoryLimitRemedied | The memory pool usage is below the maximum limit specified | |
| dttrapAutoReconnect | Auto-reconnect needs to make a new connection | |
| dttrapScheduledConnectStart | A scheduled connection has been established | |
| dttrapScheduledConnectEnd | A scheduled end connection has been reached and the connection has been disconnected | |
| dttrapAutoDisconnectWriteQueue | Auto-disconnect has forced the queue to be written to disk | |
| dttrapAutoDisconnectPauseTransmission | Auto-disconnect requested that the source pause any operation (create, modify, or delete) sending | |
| dttrapAutoDisconnectEndConnection | Auto-disconnect has intentionally dropped the connection | |
| dttrapAutoDisconnectShutdown | Auto-disconnect forced Double-Take Availability to shutdown | |
| Replication | dttrapReplicationStart | Replication has started |
| dttrapReplicationStop | Replication has stopped | |
| Mirroring | dttrapMirrorStart | Mirroring has started |
| dttrapMirrorStop | Mirroring has stopped | |
| dttrapMirrorPause | Mirroring has paused | |
| dttrapMirrorResume | Mirroring has resumed | |
| dttrapMirrorEnd | Mirroring has ended | |
| Verification | dttrapVerificationStart | Verification has started |
| dttrapVerificationEnd | Verification has ended | |
| dttrapVerificationFailure | Verification has failed | |
| Restoration | dttrapRestoreStarted | Restoration has started |
| dttrapRestoreComplete | Restoration is complete | |
| Replication Sets | dttrapRepSetModified | Replication has been modified |
| Failover | dttrapFailoverConditionMet | Manual intervention is required because failover has detected a failed source machine |
| dttrapFailoverInProgress | Failover is occurring | |
| dttrapTargetFull | The target is full |
The following table lists the Double-Take Availability SNMP statistics.
| Object Type | Statistic | Description |
|---|---|---|
| General | dtUpTime | Time in seconds since Double-Take Availability was last started |
| dtCurrentMemoryUsage | Amount of memory allocated from the Double-Take Availability memory pool | |
| dtMirOpsGenerated | The number of mirror operations (create, modify, or delete) that have been transmitted by the mirroring process | |
| dtMirBytesGenerated | The number of bytes that have been transmitted by the mirroring process | |
| dtRepOpsGenerated | The number of operations (create, modify, or delete) that have been transmitted by the replication process | |
| dtRepBytesGenerated | The number of bytes that have been transmitted by the replication process | |
| dtFailedMirrorCount | The number of operations that failed to mirror because they could not be read on the source | |
| dtFailedRepCount | The number of operations that failed to be replicated because they could not be read on the source | |
| dtActFailCount | The number of activation code errors | |
| dtAutoDisCount | The number of auto-disconnects | |
| dtAutoReCount | The number of auto-reconnects | |
| dtDriverQueuePercent | The amount of throttling calculated as a percentage of the stop replicating limit | |
| Source | dtSourceState |
|
| Target | dtTargetState |
|
| dtRetryCount | The number of file operations that have been retried | |
| dtOpsDroppedCount | The number of file operations that have failed and will not be retried | |
| Security | dtLoginCount | The number of successful logins |
| dtFailedLoginCount | The number of unsuccessful logins | |
| Connection | dtConnectionCount | The number of active connections between machines |
| dtconIpAddress | The IP address of the connected machine. If at the source, then the IP address of the target. If at the target, then the IP address of the source. | |
| dtconConnectTime | The duration of time since the connection was first established | |
| dtconState |
The state of the active connection
Only the Scheduled and Error states can coexist. All other states are mutually exclusive. SNMP will display a dtconState of 12 when the connection is in both a scheduled and an error state because this is the sum of the two values (4 + 8). |
|
| dtconOpsInCmdQueue | The number of operations (create, modify, or delete) in the retransmit queue on the source | |
| dtconOpsInAckQueue | The number of operations (create, modify, or delete) waiting for verification acknowledgements from the target | |
| dtconOpsInRepQueue | The number of replication operations (create, modify, or delete) in the queue | |
| dtconOpsInMirQueue | The number of mirror operations (create, modify, or delete) in the queue | |
| dtconBytesInRepQueue | The number of bytes in the replication queue | |
| dtconBytesInMirQueue | The number of bytes in the mirror queue | |
| dtconOpsTx | The total number of operations (create, modify, or delete) transmitted to the target | |
| dtconBytesTx | The total number of bytes transmitted to the target | |
| dtconBytesCompressedTx | The total number of compressed bytes transmitted to the target | |
| dtconOpsRx | The total number of operations (create, modify, or delete) received from the target | |
| dtconBytesRx | The total number of bytes received from the target | |
| dtconResentOpCount | The number of operations that were resent because of acknowledgement errors |
The following table contains error codes that you may see in the various user interfaces or in log files.
| Error Code | Description |
|---|---|
| -1 | Unknown error code (generated when a command failed but the failure is not linked to a pre-defined error code) |
| -101 | Invalid parameter was supplied |
| -102 | Command is not a valid or the syntax is incorrect |
| -103 | Double-Take Availability source module is not loaded |
| -104 | No Double-Take Availability source identified |
| -105 | Double-Take Availability target module is not loaded |
| -106 | Connection already established |
| -107 | Connection does not exist |
| -108 | Mirror currently active |
| -109 | Server does not exist or could not be located |
| -110 | Server is not responding |
| -111 | Double-Take Availability is running |
| -112 | Unknown connection error |
| -113 | Mirror already active |
| -114 | Date is invalid - valid format is mm/dd/yy |
| -115 | Time is invalid - valid format is hh:mm |
| -116 | Invalid option supplied |
| -117 | Mirror is not paused |
| -118 | Connection is not paused |
| -119 | Connection does not exist |
| -120 | Connection already connected |
| -121 | Mirror is not running |
| -122 | Replication set exists |
| -123 | Replication set does not exist |
| -124 | No replication set has been selected |
| -125 | Connection is replicating |
| -126 | Connection is not replicating |
| -127 | Replication set is enabled |
| -128 | Schedule is not defined |
| -129 | Replication set is changed |
| -130 | Replication set is in use |
| -131 | No Double-Take Availability target identified |
| -132 | Memory is low |
| -133 | Memory is sufficient |
| -134 | Replication is pending |
| -135 | Invalid option supplied |
| -136 | Replication set rule does not exist |
| -137 | Mirror queue is full |
| -138 | Insufficient security access |
| -139 | Schedule command is invalid |
| -140 | Source path is invalid |
| -141 | Replication set is not changed |
| -142 | Insufficient source security access |
| -143 | Invalid statistics file |
| -144 | Replication set not saved |
| -145 | Connection failed |
| -146 | Cleaner option is not enabled |
| -147 | Target mirror capacity high threshold is met |
| -148 | Target mirror capacity low threshold is met |
| -149 | New option applied |
| -150 | Target is restarted |
| -151 | Replication is out of memory |
| -152 | Write access is blocked on the volume |
| -153 | This error code could be one of two errors. 1) Compression level is not supported, or server does not support compression 2) Transmission is paused |
| -154 | Transmission is active |
| -155 | Target does not support the command |
| -156 | Command conversion to accommodate a different Double-Take Availability version has failed |
| -157 | Incompatible source and target Double-Take Availability versions |
| -158 | Incompatible source and target operating system versions |
| -159 | NAS server to non-NAS server is not a supported configuration |
| -160 | Target module is not loaded |
| -161 | Operation or command is not supported |
| -162 | Target is paused |
| -163 | Target is pending |
| -164 | Target is active |
| -165 | Target is retrying operations |
| -166 | Target is no longer retrying operations |
| -167 | Restore required state is unknown |
| -168 | Not a valid failover source |
| -169 | Failover login failed |
| -170 | Feature is not supported |
| -171 | Command is not supported |
| -172 | Target queue log file error |
| -173 | Target disk is full |
| -174 | Target disk has sufficient disk space |
| -175 | Error reading from or writing to the queue log file |
| -176 | Memory-based queue is in use |
| -177 | Disk-based queue is in use |
| -178 | Restore is required |
| -179 | ID the driver supplied to the service is invalid |
| -180 | Child path is blocked |
| -181 | Parent path is blocked |
| -182 | Target path blocking is disabled |
| -183 | Connection ID specified is invalid |
| -184 | No command objects are in the queue |
| -185 | Target is discarding operations from the target queue |
| -186 | Target is not discarding operations from the target queue |
| -187 | Schedule is paused |
| -188 | Schedule is resumed |
| -189 | Target state has changed |
| -190 | Target name has changed |
| -201 | Monitor name exists |
| -202 | Monitor name does not exist |
| -203 | Monitor configuration exists |
| -204 | Monitor configuration does not exist |
| -205 | Monitor configuration is in use |
| -206 | Monitor configuration is not in use |
| -207 | Source is online |
| -208 | Source is offline |
| -209 | Server is not failed over |
| -210 | Server is failed over |
| -211 | Server is not being monitored |
| -212 | Failback is in progress |
| -213 | IP address placeholders on the target are unavailable |
| -214 | Target NIC was not found |
| -215 | Source module is not loaded |
| -216 | Failed to set the source state |
| -217 | Unable to ping source |
| -218 | Invalid argument |
| -219 | Recovery is busy |
| -220 | Invalid command |
| -221 | Recovery is started |
| -222 | Script failed to start |
| -223 | Script timeout met |
| -224 | No replication timeout met - connection is bad |
| -225 | Invalid path |
| -226 | Kernel module is not loaded |
| -2201 | Error communicating with e-mail server |
| -2202 | Error connecting to e-mail server |
| -2203 | E-mail notification is disabled |
| -2204 | E-mail notification is enabled |
| -2205 | E-mail notification requires Internet Explorer version 5.0 and WMI |
| -2206 | E-mail notification requires Internet Explorer version 5.0 (E-mail notification no longer requires Internet Explorer 5.0 or later. If you receive this error, contact technical support.) |
| -2207 | Error sending e-mail |
| -2208 | Error sending test e-mail |
| -2209 | WMI error connecting to e-mail server |
| -2210 | E-mail notification requires WMI |
| -2211 | Event Viewer settings for e-mail notification are invalid |
| -2212 | E-mail notification setting is invalid |
| -2213 | E-mail notification address exists |
| -2214 | E-mail notification alert ID is invalid |
| -2215 | E-mail notification format is invalid |
| -2216 | E-mail notification address does not exist |
| -2217 | E-mail notification address notification list is empty |
| -2218 | E-mail warning is not set |
| -2219 | E-mail test warning is not set |
| 2200 | E-mail notification is functioning properly |
| -2301 | Bandwidth limiting time exists |
| -2302 | Bandwidth limiting name exists |
| -2303 | Bandwidth limit not found |
| -2304 | Bandwidth limit day is invalid |
| -2305 | Bandwidth limit label is invalid |
| -2401 | Snapshot module is not loaded |
| -2402 | Error reading the snapshot .dll |
| -2403 | Snapshot not found |
| -2404 | No snapshot connections found |
| -2501 | Full-server functionality is disabled |
| -2502 | No full-server interface available |
Your failover process will depend on the type of workload you are protecting.
The failover process, including script processing, can be tested at any time. To force unavailability, disconnect the network cable from a monitored machine, wait for the Time to Fail counter to decrease to zero and failover begins. To avoid the countdown delay, highlight the monitored machine name in the Failover Control Center window and select Failover.
If Manual Intervention is enabled, the Failover Control Center will prompt you when a failure occurs. Click Cancel to abort the failover process. (If necessary, you can initiate failover later from the Failover Control Center.) Click OK to proceed with failover.
| Note: |
If the Failover Control Center is not running at the time the failure occurs, the manual intervention dialog box will appear the next time the Failover Control Center is started. When a failure occurs, an alert is forwarded to the Windows event log. You can then start the Failover Control Center and respond to the manual intervention prompt. If SNMP is installed and configured, an SNMP trap is also generated. When using a third-party SNMP manager, an e-mail or page can be generated to notify you of the failure. |
You will be prompted to specify what data you want to use on the target.
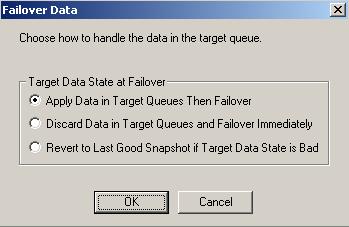
Select an option based on the table below. You may want to check the amount of data in queue on the target by reviewing the Statistics or Performance Monitor.
| Target Data State at Failover | Description | Advantages | Disadvantages |
|---|---|---|---|
| Apply Data in Target Queues Then Failover | All of the data in the target queue will be applied before failover begins. | All of the data that the target has received will be applied before failover begins. | Depending on the amount of data in queue, the amount of time to apply all of the data could be lengthy. |
| Discard Data in Target Queues and Failover Immediately | All of the data in the target queue will be discarded and failover will begin immediately. | Failover will occur immediately. | Any data in the target queue will be lost. |
| Revert to Last Good Snapshot if Target Data is Bad | If the target data is in a bad Double-Take Availability state, Double-Take Availability will automatically revert to the last good Double-Take Availability snapshot before failover begins. If the target data is in a good state, Double-Take Availability will not revert the target data. Instead, Double-Take Availability will apply the data in the target queue and then failover. | Good data on the target is guaranteed to be used. | If the target data state is bad, you will lose any data between the last good snapshot and the failure. |
After failover is complete, clients will be rerouted to the target, which is standing in for the source.
|
Note: |
If you are protecting Exchange, keep in mind the following caveats.
If you are protecting SQL, keep in mind the following caveats.
If you are protecting BlackBerry, there is a potential to lose BlackBerry instant messages and instant message contacts when an Exchange mailbox is moved, depending on the type of BlackBerry hand-held device. You should back up instant messages through the BlackBerry desktop software or have the BlackBerry Enterprise server configured to audit all instant messages through a policy. |
Full-server failover can be initiated through the Full-Server Failover Manager client or by using a command line interface.
When a failover condition is met, you will want to start failover. Additionally, you can start it without a failover condition, as long as protection is enabled. For example, you may want to force failover when upgrading to a better source server.
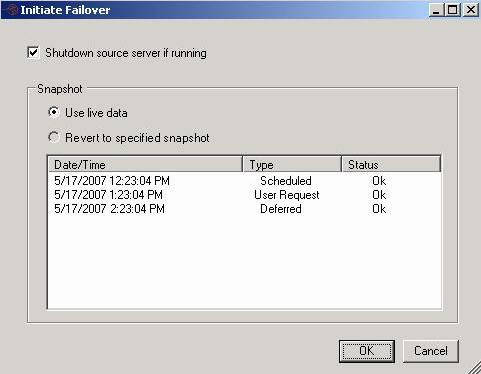
| Type | Description |
|---|---|
| Scheduled | This snapshot was taken as part of a periodic snapshot. |
| Deferred | This snapshot was taken as part of a periodic snapshot, although it did not occur at the specified interval because the connection between the source and target was not in a good state. |
| User Request | This snapshot was taken manually by a user. |
| Note: |
If you are failing over a cluster node, it is possible that volumes may lose their drive letter assignments. If a clustered application fails to start after failover and the disk signature has changed, check the drive letter assignments under the Disk Management utility and re-create drive letter assignments as needed. Because the Windows product activation is dependent on hardware, you may need to reactivate your Windows registration after failover. In most cases when you are using Windows 2003, you can follow the on-screen prompts to complete the reactivation. However, when you are using Windows 2008, the reactivation depends on your licensing type. If a Windows 2008 target comes online after failover with an activation failure, use the steps appropriate for your license type.
|
You can configure connections and initiate failover without using the Full-Server Failover Manager user interface. The same executable that launches the user interface can be used from a command prompt with options. The command line execution opens the user interface, passes through specified parameters, and initiates specified processes. You may want to use this alternate execution if you have different configuration files that you want to execute or if you have multiple connections. The Full-Server Failover Manager command can be initiated one at a time from a command prompt, or it can be scripted. The Full-Server Failover Manager executable is located in the installation directory.
| Command | FFMANAGER |
| Description | Initiates the Full-Server Failover Manager user interface, passes through specified parameters, and initiates specified processes |
| Syntax | FFMANAGER /SOURCE source_name /TARGET target_name/USERNAME username /PASSWORD password /VALIDATE /FIXALL /PROTECT /FAILOVER /LOGLEVEL number /CONFIG filename |
| Options |
|
| Examples |
|
| Notes |
|
When a failover condition has been met, failover will be triggered automatically if you configured automatic failover when establishing protection. If you configured manual intervention before failover, you can use the Application Manager to initiate failover for application workloads configured for DNS failover.
|
Note: |
In a clustered environment where the source suddenly becomes unavailable (for example, it crashes) and the Application Manager is open, it may appear to be unresponsive for up to 30 minutes before the failover process continues. The Application Manager is waiting on a Microsoft cluster file to respond. To reduce the amount of time before failover can continue, close and re-open the Application Manager. If you are protecting a file server, failover is only available if the source is offline, in order to prevent name conflicts on the network. |
In the Application Manager, make sure your source target pair is selected and then on the Monitor tab, click Failover.
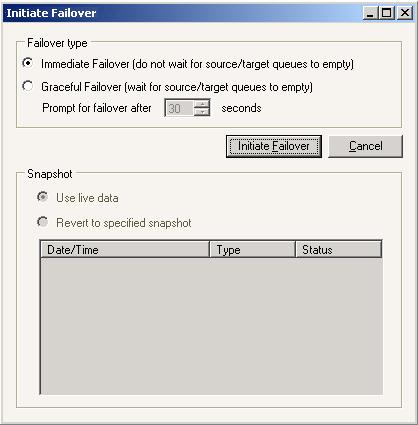
| Note: |
The graceful failover option is not available if you are protecting a SharePoint server of file server. If you are protecting an Exchange virtual server in a cluster environment, you should use the graceful failover option so that the source cluster resources are taken offline gracefully. |
| Type | Description |
|---|---|
| Scheduled | This snapshot was taken as part of a periodic snapshot. |
| Deferred | This snapshot was taken as part of a periodic snapshot, although it did not occur at the specified interval because the connection between the source and target was not in a good state. |
| User Request | This snapshot was taken manually by a user. |
Run the following command.
handheldcleanup –m
Run the command, specifying the name of the BlackBerry server when prompted.
handheldcleanup –u
|
Note: |
If you are protecting Exchange, keep in mind the following caveats.
If you are protecting SQL, keep in mind the following caveats.
If you are protecting BlackBerry, there is a potential to lose BlackBerry instant messages and instant message contacts when an Exchange mailbox is moved, depending on the type of BlackBerry hand-held device. You should back up instant messages through the BlackBerry desktop software or have the BlackBerry Enterprise server configured to audit all instant messages through a policy. |
When a failover condition has been met, failover will be triggered automatically if you configured automatic failover when establishing protection. If you configured manual intervention before failover, you can failover your protection from the console you used to establish protection. If you are protecting host-level virtual disk files (the .vmdk files) from an ESX source to an ESX target, you will need to use the Double-Take Availability for VMware Infrastructure console to initiate failover. For all other virtual workloads, use the Double-Take Console to initiate failover.
| Note: |
Once failover has occurred, if you add CPUs to the replica of the source on the target, you may have to reboot the replica before the operating system will recognize the additional CPUs. |
Your failover and restoration process will depend on the type of workload you are protecting.
Failover occurred because the target was monitoring the source for a failure, and when a failure occurred, the target stood in for the source. User and application requests that were directed to the failed source are routed to the target.
While the users are accessing their data on the target, you can repair the issue(s) on the source. Before users can access the source again, you will need to restore the data from the target back to the source and perform failback. Failback is the process where the target releases the source identity it assumed during failover. Once failback is complete, user and application requests are no longer routed to the target, but back to the source.
Ideally, you want to restore your data from the target back to the source before you failback. This allows users who are currently accessing their data on the target because of failover to continue accessing their data. Restoration before failback reduces user downtime. The procedure to restore and then failback varies widely with server and network configuration. Another method, which may be easier in some environments, allows you to failback first and then restore the data from the target to the source. A possible disadvantage to this process is that users may experience longer downtime, depending on the amount of data to be restored, because they will be unable to access their data during both the restoration and the failback.
Restoring before failing back allows your users to continue accessing their data on the failed over target, which is standing in for the source, while you perform the restoration process. The key to this process is to keep the users off of the source, but allow the source and target to communicate to perform the restoration.
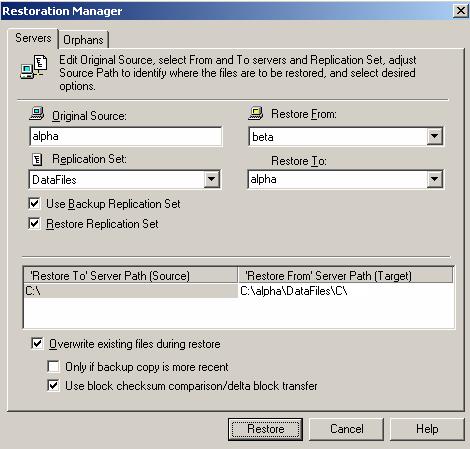
| Note: | If your target is a cluster, you can specify just one node in the cluster and restore only from that node. If you need to have the cluster functionality (Microsoft failover from node to node) available during the restoration process, you will have to create a resource, like you did for your original connection, for the restoration process. See Protecting a standard cluster. Keep in mind when restoring, your target will function as your source, sending data to the target, which will be your original or new source. |
| Note: |
Restoring across a NAT router requires the ports to be the same as the original connection. If the ports have been modified (manually or reinstalled), you must set the port numbers to the same values as the last valid source/target connection. |
| Note: |
If you are using a database application, do not use the newer option unless you know for certain you need it. With database applications, it is critical that all files, not just some of them that might be newer, get mirrored. |
| Note: | If the target is a cluster, you will need to determine the active node and failback from that node. Then you will need to failback from each of the other nodes to synchronize all of the nodes of the cluster. |
| Note: |
If your target is a cluster, take the Double-Take Source Connection resource offline to disconnect the connection. During the restoration, only the data is restored back to the source. Shares are not created on the source during the restoration. Shares that were created on the target during failover will need to be created manually on the source. |
| Note: |
The source must be online and Double-Take Availability must be running to ensure that the source post-failback script can be started. If the source has not completed its boot process, the command to start the script may be lost and the script will not be initiated. |
Failback before restoration can be a simpler process, but it may require additional downtime. The amount of downtime will depend on the amount of data to be restored. Users must be kept off of the source and target during this entire process.
| Note: |
If the target is a cluster, you will need to determine the active node and failback from that node. Then you will need to failback from each of the other nodes to synchronize all of the nodes of the cluster. |
| Note: |
The source must be online and Double-Take Availability must be running to ensure that the source post-failback script can be started. If the source has not completed its boot process, the command to start the script may be lost and the script will not be initiated. |
| Note: |
If your target is a cluster, you can specify just one node in the cluster and restore only from that node. If you need to have the cluster functionality (Microsoft failover from node to node) available during the restoration process, you will have to create a resource, like you did for your original connection, for the restoration process. See Protecting a standard cluster. Keep in mind when restoring, your target will function as your source, sending data to the target, which will be your original or new source. |
| Note: |
Restoring across a NAT router requires the ports to be the same as the original connection. If the ports have been modified (manually or reinstalled), you must set the port numbers to the same values as the last valid source/target connection. |
| Note: |
If you are using a database application, do not use the newer option unless you know for certain you need it. With database applications, it is critical that all files, not just some of them that might be newer, get mirrored. |
| Note: |
If your target is a cluster, take the Double-Take Source Connection resource offline to disconnect the connection. During the restoration, only the data is restored back to the source. Shares are not created on the source during the restoration. Shares that were created on the target during failover will need to be created manually on the source. |
After your target has failed over and becomes your source, you can stay with that configuration long term. However, in some instances, it may be necessary or desired to go back to using the original hardware after you have failed over. Use the following process to failback to your original (or other) hardware.
When protecting application workloads, your failback and restoration process will depend on if you configured your application for identity or DNS failover.
For application workloads that were configured for identity failover, you need to stop the services on your source that correspond with your application before you begin the failback and restoration process. Use the table below as a guideline for the services to stop. After you have stopped the services on the source, use the instructions for data workload failback and restoration to complete your application failback and recovery.
| Note: |
If you were protecting Exchange, after the restoration is complete, you will need to rehome the informational store databases to the source.
|
| Application | Services to Stop |
|---|---|
| Exchange 2007 |
|
| Exchange 2003 |
|
| SQL Server |
|
| SharePoint |
|
| BlackBerry |
|
| File server |
|
For application workloads that were configured for DNS failover, you can use the Application Manager to initiate failback and, if desired restore data from the target back to the source. In order to minimize downtime, the restoration process is completed before the failback.
| Note: | When you bring the source cluster online, an identical network name will be active on the target. Therefore, when the source cluster tries to bring the Exchange virtual server on the source online, the network name resource will fail and the group will not come online. Allow the source cluster to finish trying to bring the resources online before beginning failback. |
| Note: | The Failback button may not become active right away after completing a failover. In this case, restart the Application Manager. |
Specify the options for your failback and restoration.
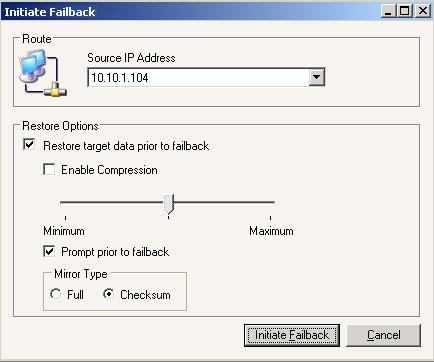
| Note: |
If you are protecting Exchange, keep in mind the following caveats.
|
A unique connection ID is associated with each Double-Take Availability connection. The connection ID provides a reference point for each connection. The connection ID is determined by sequential numbers starting at one (1). Each time a connection is established, the ID counter is incremented. It is reset back to one each time the Double-Take service is restarted. For example, if the Double-Take service was started and the same replication set was connected to five target machines, each connection would have a unique connection ID from 1 to 5. The connection can be in various states as described in the following table.
| Connection Status | Description |
|---|---|
| Started |
The network connection exists and is available for data transmission. Replication and mirror data are transmitted to the target as soon as possible. This is the standard state that you will see most often. |
| Stopped | Double-Take Availability has linked the source and target, but the network connection does not exist. Replication and mirror data are not transmitted to the target but are held in queue on the source. |
| Paused |
The network connection exists and is available for data transmission, but the replication and mirror data is being held in a queue and is not being transmitted to the target. |
| Scheduled |
Double-Take Availability has linked the source and target, but the network connection is not established until event driven or scheduling criteria have been met. |
| Error |
A transmission error has occurred. Possible errors include a broken physical line or a failed target service. |
You can perform the following functions to manage your connections.
During the Double-Take Availability installation, you identified the amount of disk space that can be used for Double-Take Availability queuing. Queuing to disk allows Double-Take Availability to accommodate high volume processing that might otherwise fill-up system memory. For example, on the source, this may occur if the data is changing faster than it can be transmitted to the target, or on the target, a locked file might cause processing to back up.
The following diagram will help you understand how queuing works. Each numbered step is described after the diagram.
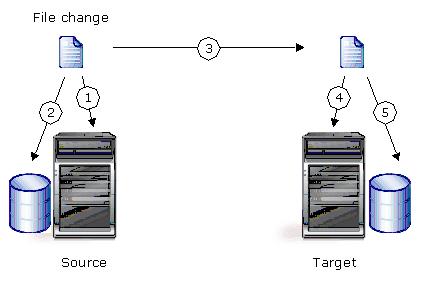
| Note: |
You may notice transaction log files that are not the defined size limit. This is because data operations are not split. For example, if a transaction log has 10 KB left until the limit and the next operation to be applied to that file is greater than 10 KB, a new transaction log file will be created to store that next operation. Also, if one operation is larger than the defined size limit, the entire operation will be written to one transaction log. |
Like the source, system memory on the target contains the oldest data so when data is applied to the target, Double-Take Availability pulls the data from system memory. Double-Take Availability automatically moves operations from the oldest transaction log file to system memory. As a transaction log is depleted, it is deleted. When all of the transaction log files are deleted, data is again written directly to system memory (step 4).
You should configure queuing on both the source and target.
Specify the queue settings for the server.
Folder—This is the location where the disk queue will be stored. Double-Take Availability displays the amount of free space on the volume selected. Any changes made to the queue location will not take effect until the Double-Take service has been restarted on the server.
When selecting the queue location, keep in mind the following caveats.
Although the read/write ratio on queue files will be 1:1, optimizing the disk for write activity will benefit performance because the writes will typically be occurring when the server is under a high load, and more reads will be occurring after the load is reduced. Accordingly, use a standalone disk, mirrored (RAID 1) or non-parity striped (RAID 0) RAID set, and allocate more I/O adapter cache memory to writes for best performance. A RAID 5 array will not perform as well as a mirrored or non-parity striped set because writing to a RAID 5 array incurs the overhead of generating and writing parity data. RAID 5 write performance can be up to 50% less than the write performance of a single disk, depending on the adapter and disk.
Another option is to use a solid state disk, which are hard drives that use RAM instead of disk platters. These devices are typically quite costly, but they will provide superior performance as a queuing device when the best performance is required.
| Note: | Scanning the Double-Take Availability queue files for viruses can cause unexpected results. If anti-virus software detects a virus in a queue file and deletes or moves it, data integrity on the target cannot be guaranteed. As long as you have your anti-virus software configured to protect the actual production data, the anti-virus software can clean, delete, or move an infected file and the clean, delete, or move will be replicated to the target. This will keep the target from becoming infected and will not impact the Double-Take Availability queues. |
Maximum system memory for queue—This is the amount of Windows system memory, in MB, that will be used to store data in queues. When exceeded, queuing to disk will be triggered. This value is dependent on the amount of physical memory available but has a minimum of 32 MB. By default, 128 MB or 512 MB of memory is used, depending on your operating system. If you set it lower, Double-Take Availability will use less system memory, but you will queue to disk sooner which may impact system performance. If you set it higher, Double-Take Availability will maximize system performance by not queuing to disk as soon, but the system may have to swap the memory to disk if the system memory is not available.
Since the source is typically running a production application, it is important that the amount of memory Double-Take Availability and the other applications use does not exceed the amount of RAM in the system. If the applications are configured to use more memory than there is RAM, the system will begin to swap pages of memory to disk and the system performance will degrade. For example, by default an application may be configured to use all of the available system memory when needed, and this may happen during high-load operations. These high-load operations cause Double-Take Availability to need memory to queue the data being changed by the application. In this case, you would need to configure the applications so that they collectively do not exceed the amount of RAM on the server. Perhaps on a server with 1 GB of RAM running the application and Double-Take Availability, you might configure the application to use 512 MB and Double-Take Availability to use 256 MB, leaving 256 MB for the operating system and other applications on the system. Many server applications default to using all available system memory, so it is important to check and configure applications appropriately, particularly on high-capacity servers.
Any changes to the memory usage will not take effect until the Double-Take service has been restarted on the server.
| Note: | The Maximum disk space for queue and Minimum Free Space settings work in conjunction with each other. For example, assume your queues are stored on a 10 GB disk with the Maximum disk space for queue set to 10 GB and the Minimum Free Space set to 500 MB. If another program uses 5 GB, Double-Take Availability will only be able to use 4.5 GB so that 500 MB remains free. |
While disk queues are user configurable and can be extensive, they are limited. If the amount of disk space specified for disk queuing is met, additional data could not be added to the queue and data would be lost. To avoid any data loss, the auto-disconnect and auto-reconnect processes occur.
| Note: |
If you are experiencing frequent auto-disconnects, you may want to increase the amount of disk space on the volume where the Double-Take Availability queue is located or move the disk queue to a larger volume. If you have changed data on the target while not failed over, for example if you were testing data on the target, Double-Take Availability is unaware of the target data changes. You must manually remirror your data from the source to the target, overwriting the target data changes that you caused, to ensure data integrity between your source and target. |
Use the following steps to configure automatic reconnections.
You can break the source/target connection without disconnecting the connection, so that you can control the transmission of data across the network. You can do this by pausing the target. If the target is paused, data is queued on the source until you manually resume the target.
For example, you must pause the target while you perform a backup of database files stored on the target because the database and log files must be backed up when they are at the exact same point in time. For example, say the backup of the file mydatabase.mdf begins on the target. While the backup program has access to the file, Double-Take Availability cannot write to the file. When the backup completes, Double-Take Availability writes to the file. Double-Take Availability also writes to the corresponding mydatabase.ldf file. When the backup gets to the mydatabase.ldf file, it no longer matches the .mdf file. The database may require special startup procedures, which may result in incomplete transactions being left in the database or data loss. To workaround this scenario, pause the target before starting the backup and then resume the target when the backup is complete.
While the target is paused, the Double-Take Availability source cannot queue data indefinitely. If the source queue is filled, Double-Take Availability will automatically disconnect the connections and attempt to reconnect them.
To pause a target, open the Replication Console and right-click a target server on the left pane of the Replication Console. Select Pause Target. All active connections to that target will complete the operations already in progress. You will see Pause Pending in the Replication Console while these operations are completed. The status will update to Paused after the operations are completed. Any new operations will be queued on the source until the target is resumed. When you are ready to resume the target, right-click the target and select Resume Target.
| Note: |
If you have multiple connections to the same target, all connections will be paused and resumed. |
You can block writing to the paths on the target that contain the copy of the replication set data. This keeps the data from being changed outside of Double-Take Availability processing. To block the replication set data paths on the target, open the Replication Console, and right-click the connection on the right pane of the Replication Console. Select Block Target Path(s). To unblock the paths, right-click the connection and deselect Block Target Path(s).
| Note: |
If you are going to use failover, any target paths that are blocked will automatically be unblocked during the failover process so that users can modify data on the target after failover. During a restoration, the paths are automatically blocked again. If you failover and failback without performing a restoration, the target paths will remain unblocked. You can manually block or unblock the target paths by right-clicking on a connection. Do not block your target paths if you are protecting a full-server because system state data will not be able to be written to the target. |
To disconnect a Double-Take Availability connection, open the Replication Console, and right-click the connection on the right pane of the Replication Console. Select Disconnect. The source and target will be disconnected.
| Note: |
If a connection is disconnected and the target is monitoring the source for failover, you will be prompted if you would like to continue monitoring for a failure. If you select Yes, the Double-Take Availability connection will be disconnected, but the target will continue monitoring the source. To make modifications to the failure monitoring, you will need to use the Failover Control Center. If you select No, the Double-Take Availability connection will be disconnected, and the source will no longer be monitored for failure by the target. If a connection is disconnected while large amounts of data still remain in queue, the Replication Console may become unresponsive while the data is being flushed. The Replication Console will respond when all of the data has been flushed from the queue. |
Mirroring is one of the key components of Double-Take Availability. You can perform the following functions to manage mirroring.
After a connection is established, you need to be able to control the mirroring. You can start, stop, pause and resume mirroring. open the Replication Console, and right-click the connection on the right pane of the Replication Console. Select Mirroring and the appropriate mirror control.
| Note: |
If you are using a database application, do not use the newer option unless you know for certain you need it. With database applications, it is critical that all files, not just some of them that might be newer, get mirrored. |
An X enclosed in parentheses (X) indicates that the global option on the Server Properties Source tab can be on or off. The use of this option does not change the action performed during the mirror.
| Server Properties Source Tab | Connection Manager Mirroring Tab or Start Mirror Dialog | Action Performed | ||
|---|---|---|---|---|
| Checksum All | File Differences | Only if Source is Newer | Checksum | |
| (X) | X | Any file that is different on the source and target based on the date, time, and/or size is transmitted to the target. The mirror sends the entire file. | ||
| (X) | X | X | Any file that is newer on the source than on the target based on date and/or time is transmitted to the target. The mirror sends the entire file. | |
| X | X | Any file that is different on the source and target based on date, time, and/or size is flagged as different. The mirror then performs a checksum comparison on the flagged files and only sends those blocks that are different. | ||
| X | X | X | The mirror performs a checksum comparison on all files and only sends those blocks that are different. | |
| (X) | X | X | X | Any file that is newer on the source than on the target based on date and/or time is flagged as different. The mirror then performs a checksum comparison on the flagged files and only sends those blocks that are different. |
In certain circumstances, for example if the disk-based queues on the source are exhausted, Double-Take Availability will automatically disconnect connections (called auto-disconnect) and then automatically reconnect them (called auto-reconnect). In order to ensure data integrity on the target, Double-Take Availability will perform an automatic mirror (called an auto-remirror) after an auto-reconnect.
| Note: |
Auto-remirror is a per source option. When enabled, all connections from the source will perform an auto-remirror after an auto-reconnect. When disabled, none of the connections from the source will perform an auto-remirror after an auto-reconnect. |
| Note: | If auto-remirror is disabled and an auto-reconnect occurs, the transmission state of the connection will remain pending after the reconnect until a mirror is started manually. |
| Note: |
Database applications may update files without changing the date, time, or file size. Therefore, if you are using database applications, you should use the Differences with checksum or Full option. Stopping, starting, pausing, or resuming mirroring contains a comparison of how the file difference remirror settings work together, as well as how they work with the global checksum setting on the Source tab of the Server Properties. |
You can customize your mirroring process by running customized scripts on the target at predefined points in the mirroring process. Scripts may contain any valid Windows command, executable, batch, or script file. The scripts are processed using the same account running the Double-Take service, unless you provide specific credentials on the Server Properties Script Credentials tab for the target server. There are three types of mirroring scripts.
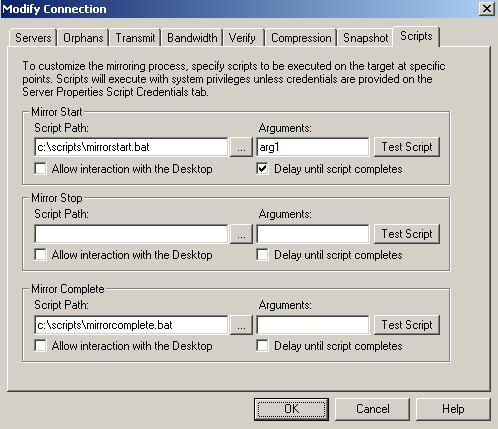
| Note: | Mirror scripts are dependent on the target and target path location of a connection. Therefore, if you establish mirror scripts for one connection and then establish additional connections to the same target using the same target path location, the mirror scripts will automatically be applied to those subsequent connections. If you select a different target path location, the mirror scripts will have to be reconfigured for the new connection(s). |
An orphan file is a file that exists in the target’s copy of the replication set data, but it does not exist in the source replication set data. An orphan file can be created when you delete a file contained in the source replication set while there is no Double-Take Availability connection. For example, if a connection was made and a mirror was completed and then the connection was stopped and a file was deleted on the source, an orphan file will exist on the target. Because the connection has been disconnected, the delete operation is not replicated to the target and the file is not deleted on the target. Additionally, orphan files may also exist if files were manually copied into or deleted from the location of the target’s copy of the replication set data.
You can configure orphan files to be moved or deleted automatically during a mirror, verify, or restore, or you can move or delete orphan files manually at any time. You can move or delete all orphan files on the target or only those orphan files that are older than a specified period of time. The results of orphan processing are maintained in the Double-Take Availability log on the target, including the number of moved/deleted orphan files, the directories, and the number of bytes.
| Note: |
Orphan file configuration is a per target option. All connections to the same target will have the same orphan file configuration. The orphans feature does not move or delete alternate data streams. To do this, use a full mirror which will delete the additional stream(s) when the file is re-created. If Double-Take Availability is configured to move orphan files, the Double-Take Availability log file will indicate that orphan files have been deleted even though they have actually been moved. This is a reporting issue only. If delete orphans is enabled, directories and files that do not exist on the source and are excluded in the replication set using a wildcard rule will be removed from the target path. If you have data in your target path that does not exist on the source, do not use wildcard rules in your replication set. Manually select and deselect those files which should be included or excluded from your replication set. |
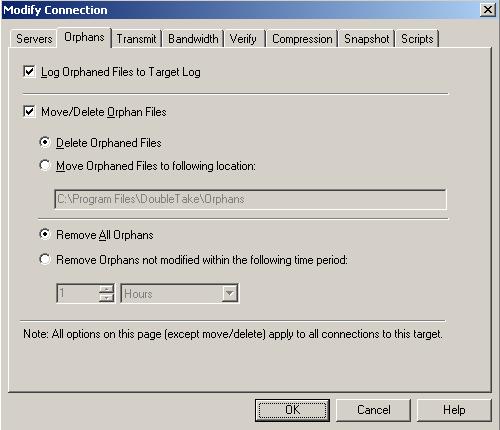
| Note: |
If you are moving files, make sure the directory you specify to move the files to is not included in the destination of the replication set data so that the orphan files are only moved once. |
Replication is one of the key components of Double-Take Availability. This section contains the following replication topics.
Double-Take Availability replicates file and directory data stored on any Windows file system (FAT, FAT32, NTFS4, and NTFS5). Replicated items also include Macintosh files, compressed files, NTFS attributes and ACLs (access control list), dynamic volumes, files with alternate data streams, sparse files, and encrypted files. Files can be replicated across mount points, even though mount points are not created on the target. Some reparse points are replicated, including CommVault Data Migrator and BridgeHead Software HT FileStore.
Double-Take Availability does not replicate items that are not stored on the file system, such as physical volume data and registry based data. Additionally, Double-Take Availability does not replicate NTFS extended attributes, registry hive files, Windows or any system or driver pagefile, system metadata files ($LogFile, $Mft, $BitMap, $Extend\\$UsnJrnl, $Extend\\$Quota, $Extend\\$ObjId, and $Extend\\$Reparse), hard links, or the Double-Take Availability disk-based queue logs. The only exception to these exclusions is for the full-server workloads. If you are protecting your system state and data using full-server protection, Double-Take Availability will automatically gather and replicate all necessary system state data, including files for the operating system and applications.
Note the following replication caveats.
During a Double-Take Availability mirror, the transacted view of the data on the source is used. This means the data on the target will be the same as the transacted view of the data on the source. If there are pending transactions, the Double-Take Availability Target Data State will indicate Transactions Pending. As the pending transactions are committed or aborted, Double-Take Availability mirrors any necessary changes to the target. Once all pending transactions are completed, the Target Data State will update to OK.
If you see the pending transactions state, you can check the Double-Take Availability log file for a list of files with pending transactions. As transactions are committed or aborted, the list is updated until all transactions are complete, and the Target Data State is OK.
A replication set defines the data on a source machine that Double-Take Availability protects. Replication sets are defined by volumes, directories, files, or wild card combinations. Creating multiple replication sets allows you to customize sets of data that need to be protected. When working with data workloads, you need to define the replication set data yourself. If you are protecting full-server, application, virtual, or cluster workloads, the replication set is automatically defined for you.
When a replication set is created, a series of rules are defined that identify the volumes, directories, files, and/or wild card combinations that will be replicated to the target. Each rule includes:
For example, a replication set rule might be volume\directory\* inc, rec
This specifies that all files contained in the volume\directory path are included in the replication set. Because recursion is set, all files and subdirectories under volume\directory are also included. A complete replication set becomes a list of replication set rules.
Replication sets offer flexibility tailoring Double-Take Availability to your environment. For example, multiple replication sets can be created and saved for a source to define a unique network configuration. There may be three replication sets - Critical Data, User Data, and Offsite Data. Critical Data could be configured to replicate, in real-time, to an onsite high-availability server. Offsite Data is replicated across a WAN and, therefore, is configured to queue changes until a sufficient amount of data is changed to justify transmission. At that point, the connection is made and stays active until all the data is transmitted. User Data is not replicated throughout the day, but a nightly changed file mirror copies only blocks of data that are different between the source and target server prior to a nightly tape backup operation being run on the target server. Each of these replication sets can be automated to transmit as needed, thus protecting your entire environment.
Keep in mind the following notes when creating and working with replication sets and connections.
Before you can establish a connection, you must create a replication set.
| Note: |
The default number of files that are listed in the right pane of the Replication Console is 2500, but this is user configurable. A larger number of file listings allows you to see more files in the Replication Console, but results in a slower display rate. A smaller number of file listings displays faster, but may not show all files contained in the directory. To change the number of files displayed, select File, Options and adjust the File Listings slider bar to the desired number. To hide offline files, such as those generated by snapshot applications, select File, Options and disable Display Offline Files. Offline files and folders are denoted by the arrow over the lower left corner of the folder or file icon. |
| Note: | Be sure and verify what files can be included by reviewing Replication capabilities. |
There may be times when you cannot browse for data when creating a replication set. For example, you can create a replication set rule for a directory or file that does not exist. Since you cannot browse for the location, you have to create replication set rule manually. At other times, the data you want to replicate cannot be easily selected from the Replication Console. For example, you may want to select all .db files from a specific volume or directory. This task may be easier to complete by creating the replication set rule manually. Use the following instructions to create or modify a replication set rule manually.
Double-Take Availability allows you to make modifications to a replication set when you want to change the data you wish to protect. This allows you to add, remove, or modify any replication set rules without having to create a new replication set.
| Note: |
If you save changes to a connected replication set, it is recommended that you perform a mirror to guarantee data integrity between the source and target machines. A dialog box will appear instructing you to disconnect and reconnect the replication set and perform a difference mirror. If your source is a cluster, you must make the same modifications to the replication set on the non-owning nodes. The replication set rules must be identical on all nodes for Double-Take Availability to function properly on the cluster. |
To rename or copy a replication set, open the Replication Console. Click once on a highlighted replication set name to edit the field. Specify a unique name and press Enter. The process is similar to renaming a folder in Windows Explorer. If the original replication set has not been saved (red icon), the new name replaces the original name. If the original replication set is saved (black icon), the new name creates a copy of the original replication set.
| Note: |
If you save changes to a connected replication set, it is recommended that you perform a mirror to guarantee data integrity between the source and target machines. A dialog box will appear instructing you to disconnect and reconnect the replication set and perform a difference mirror. If your source is a cluster, you must make the same modifications to the replication set on the non-owning nodes. The replication set rules must be identical on all nodes for Double-Take Availability to function properly on the cluster. |
While Double-Take Availability is mirroring, the right pane of the Replication Console displays statistics to keep you informed of its progress. If the size of the replication set is determined before the mirror is started, Double-Take Availability can display the percentage of the replication set that has been mirrored in the Mirror Status column. If the size was not calculated prior to starting the mirror, the column displays Mirroring.
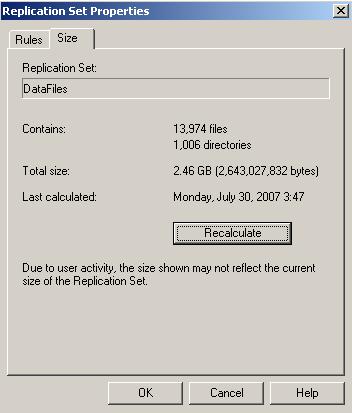
| Note: |
You can also configure the replication set calculation when establishing a connection through the Connection Manager by selecting Calculate Replication Set size on connection on the Mirroring tab. If your replication set contains a large number of files, for example, ten thousand or more, you may want to disable the calculation of the replication set size so that data will start being mirrored sooner. If calculation is enabled, the source calculates the file size before it starts mirroring. This can take a significant amount of time depending on the number of files and system performance. Disabling calculation will result in the mirror status not showing the percentage complete or the number of bytes remaining to be mirrored. |
You can only delete a replication set if it is not currently connected. If the replication set is connected, you must disconnect the connection and then delete the replication set.
To delete a replication set, open the Replication Console. Right-click the replication set icon and select Delete. Additionally, you can highlight the replication set and press the Delete key on the keyboard.
Starting replication when establishing a connection is the default and recommended configuration. If replication is not started, data is not added to the queue on the source, and source/target data integrity is not guaranteed.
To start replication, open the Replication Console. Right-click the connection on the right pane of the Replication Console and select Replication, Start. After starting replication, you should perform a remirror to guarantee the source and target data are identical.
Task command processing is a Double-Take Availability feature that allows you to insert and run tasks at various points during the replication of data. Because the tasks are user-defined, you can achieve a wide variety of goals with this feature. For example, you might insert a task to create a snapshot or run a backup on the target after a certain segment of data from the source has been applied on the target. This allows you to coordinate a point-in-time backup with real-time replication.
Task command processing can be enabled from the Replication Console, but it can only be initiated through the scripting language. See the Scripting Guide for more information.
To enable task command processing open the Replication Console. Right-click a server in the left pane of the Replication Console, select Properties, select the Setup tab, and select Enable Task Command Processing.
| Note: | If you disable this option on a source server, you can still submit tasks to be processed on a target, although task command processing must be enabled on the target. |
Verification is the process of confirming that the data on the target is identical to the data on the source. Verification creates a log file detailing what was verified as well as which files are not synchronized. If the data is not the same, Double-Take Availability can automatically initiate a remirror. The remirror ensures data integrity between the source and target.
| Note: | Because of the way the Windows Cache Manager handles memory, machines that are doing minimal or light processing may have file operations that remain in the cache until additional operations flush them out. This may make Double-Take Availability files on the target appear as if they are not synchronized. When the Windows Cache Manager releases the operations in the cache on the source, the files will be updated on the target. |
A manual verification can be run anytime a mirror is not in progress.
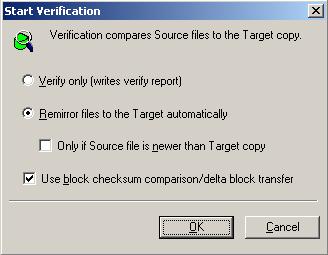
| Note: |
If you are using a database application, do not use the newer option unless you know for certain you need it. With database applications, it is critical that all files, not just some of them that might be newer, get mirrored. |
| Note: |
Database applications may update files without changing the date, time, or file size. Therefore, if you are using database applications, you should use the block checksum comparison to ensure proper verification and remirroring. |
Verification can be scheduled to occur automatically at periodic intervals.
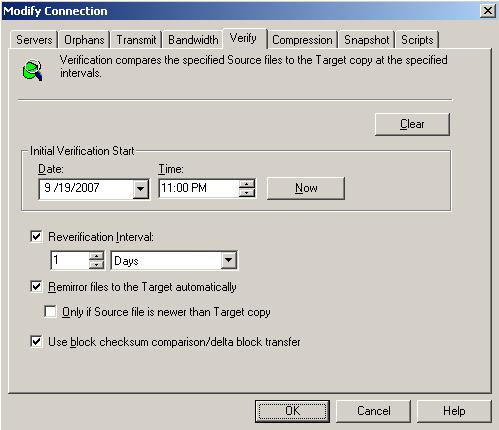
| Note: |
If you are using a database application, do not use the newer option unless you know for certain you need it. With database applications, it is critical that all files, not just some of them that might be newer, get mirrored. |
| Note: |
Database applications may update files without changing the date, time, or file size. Therefore, if you are using database applications, you should use the block checksum comparison to ensure proper verification and remirroring. |
A verification log is created on the source during the verification process. The log identifies what is verified as well as which files are not synchronized.
| Note: | Changes made to the verification log in the Server Properties, Logging tab will apply to all connections from the current source machine. |
In the log file, each verification process is delineated by beginning and end markers. A list of files that are different on the source and target is provided as well cumulative totals for the verification process. The information provided for each file is the state of its synchronization between the source and the target at the time the file is verified. If the remirror option is selected so that files that are different are remirrored, the data in the verify log reflects the state of the file before it is remirrored, and does not report the state of the file after it is remirrored. If a file is reported as different, review the output for the file to determine what is different.
|
--- VERIFICATION OF CONNECTION 2 (Sales data for alpha --> 206.31.65.40 : 1100) --- Start Time: 1/24/2010 12:15:20 PM for connection 2 (Sales data for alpha --> 206.31.65.40 : 1100) File: beta\users\bob\budget.xls DIFFERENT ON TARGET Source Attributes: Timestamp = 1/17/2010 8:21:36 PM Size = 1272 Mask = [0x20] Target Attributes: Timestamp = 1/17/2010 8:21:36 PM Size = 1272 Mask = [0x20] Security descriptors are different. 0 BYTES OUT OF SYNC File: beta\users\bill\timesheet.xls DIFFERENT ON TARGET Source Attributes: Timestamp = 1/17/2010 8:21:37 PM Size = 1272 Mask = [0x20] Target Attributes: Timestamp = 1/17/2010 8:21:37 PM Size = 1272 Mask = [0x23] 0 BYTES OUT OF SYNC File: beta\users\vincent\training.doc DIFFERENT ON TARGET Source Attributes: Timestamp = 1/12/2010 3:28:20 PM Size = 17 Mask = [0x20] Target Attributes: Timestamp = 1/20/2010 5:05:26 PM Size = 2 Mask = [0x20] 17 BYTES OUT OF SYNC Completion Time: 1/24/2010 12:37:44 PM for connection 2 (Sales data for alpha --> 206.31.65.40 : 1100) Elapsed Time (seconds): 1320.256470 Total Directories Compared: 657 Total Directories Missing: 0 Total Directories Remirrored: 0 Total Files Compared: 120978 Total Files Missing: 0 Total Files Different: 3 Total Files Encrypted: 0 Total Files Remirrored: 1 Total Bytes Skipped: 0 Total Bytes Compared: 18527203678 Total Bytes Missing: 0 Total Bytes Different: 17 Total Bytes Remirrored: 17 Related links and directory attributes have been adjusted. ----- END OF VERIFICATION ----- |
The mask must be converted in order to determine what attributes are assigned to a file. The mask is a hexadecimal number corresponding to a binary number that indicates what the attributes are. Using the following steps, you can determine how the mask corresponds to the attributes of a file.
| Position (from right to left) | Attribute | Sample Hexadecimal Number 23 |
|---|---|---|
| 1 | Read only | 1 |
| 2 | Hidden | 1 |
| 3 | None | 0 |
| 4 | System | 0 |
| 5 | Directory | 0 |
| 6 | Archive | 1 |
| 7 | Encrypted | 0 |
| 8 | Normal | 0 |
| 9 | Temporary | 0 |
| 10 | Sparse file | 0 |
| 11 | Reparse point | 0 |
| 12 | Compressed | 0 |
|
13 |
Offline | 0 |
| 14 | Not content indexed | 0 |
| 15 | None | 0 |
| 16 | None | 0 |
| Note: | Files that were replicated with the Replicate NT Security by Name feature enabled, will be identified as different in the log file because of the local name attribute. The files will be the same. |
The application verification process confirms that an Exchange or SQL application database on the target is viable for failover.
| Note: |
The application verification process is not available for Exchange or SQL in a cluster environment. The application verification process can only be performed on active connections that are in a good state and are not failed over. |
If desired, you can verify your application on the target by using the TDV utility from the command line.
| Command | TDV |
| Description | Utility that confirms that the application database on the target is viable for failover |
| Syntax |
TDV /APPTYPE <SQL | EXCHANGE> /DNSDOMAIN <domain_name> /SRCNAME <source_name> /TARNAME <target_name> /MODE <INSTANCE|DATABASE> [/PORT <port_number>] [/USERNAME <user_name>] [/PASSWORD <password>] /SVC <APP|ALL> [/ADDONSVC <service1,service2, ..>] [/SETPASSWORD <username> <password>] [/GETPASSWORD] [/SCRIPTPOST <post_online>] [/SCRIPTPRE <pre_restore>] /SRCEXCHVER <2003|2007> /TAREXCHVER <2003|2007> /SRCVER <2000|2005|2008|MSDE|EXPR> /TARVER <2000|2005|2008|MSDE|EXPR> [/INTERACTIVE] [/HELP] |
| Options |
|
| Examples |
|
| Notes |
|
Double-Take Availability data is continuously transmitted to the target machine. Although the data may be queued if the network or target machine is slow, the default transmission setting is to transmit the data as soon as possible. You can modify the transmission to suit your environment.
To start, pause, or resume the transmission of data from the source to the target, open the Replication Console. Right-click an established connection, select Transmit and the appropriate transmission control.
Using the Connection Manager Transmit tab, you can set start and stop criteria along with a schedule window.
| Note: |
Double-Take Availability checks the schedule once every second, and if a user-defined criteria is met, transmission will start or stop, depending on the option specified. Any replication sets from a source connected to the same IP address on a target will share the same scheduled transmission configuration. |
At the top of the Transmit tab dialog box, the Enable Transmission Limiting check box allows you to turn the transmission options on or off. You can enable the transmission options by marking the Enable Transmission Limiting check box when you want the options to be applied, but you can disable the transmission options, without losing the settings, by clearing that check box.
Also at the top of the Transmit tab dialog box, the Clear All button, when selected, will remove all transmission limitations that have been set under any of the limit types. The Clear button will clear the settings only for the Limit Type selected.
Define the start options for Double-Take Availability transmission by using any combination of the following options.
![]()
| Note: |
A Transmission Session Start setting will override any other start criteria. For example, if you set the Transmission Session Start and the Queue Threshold, transmission will not start until you reach the indicated start time. |
Define the stop options to stop Double-Take Availability transmissions by using either or both of the following options.
![]()
| Note: |
The transmission start and stop criteria should be used in conjunction with each other. For example, if you set the Queue Threshold equal to 10 MB and the Byte Limit equal to 10 MB, a network connection will be established when there is 10 MB of data in the queue. The data will be transmitted and when the 10 MB Byte Limit is reached, the network connection closes. This is useful in configurations where metered charges are based on connection time. |
| Note: |
Setting a transmission window by itself is not sufficient to start a transmission. You still need to set a start criteria within the window. |
Define a window to control Double-Take Availability transmissions by enabling the feature and then specifying both window options.
![]()
Bandwidth limitations are available to restrict the amount of network bandwidth used for Double-Take Availabilitydata transmissions. The network administrator specifies a percentage of bandwidth that is available or an absolute bandwidth limit for Double-Take Availability transmissions and Double-Take Availability never exceeds that allotted amount. The bandwidth not in use by Double-Take Availability is available for all other network traffic. You can schedule when you want bandwidth limiting to occur.
| Note: |
Any replication sets from a source connected to the same IP address on a target will share the same bandwidth limitation configuration. You will not be able to set a limit lower than 100% of a 28.8 Kbps connection speed. A setting this low would cause abnormal behavior between Double-Take Availability servers because of the lengthy delay between commands and responses transmitted between the two servers. You cannot set a bandwidth limit of zero (0). If you need to stop data transmission completely, use the stop criteria on the Connection Manager Transmit tab. |
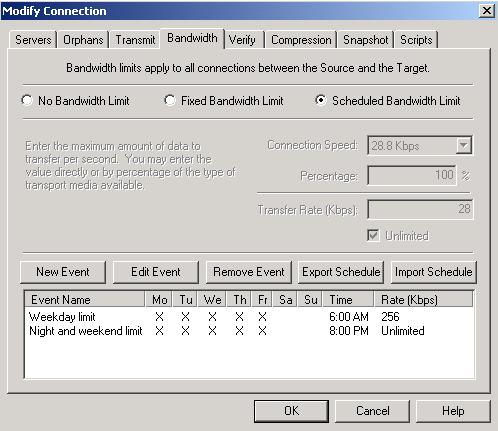
| Note: |
You can establish a bandwidth schedule and then disable or override it by selecting No Bandwidth Limit or Fixed Bandwidth Limit. The schedule criteria will be saved and will not be reactivated until you reselect Scheduled Bandwidth Limit. You can modify the bandwidth limits applied to a connection that is already established by right-clicking on the connection and selecting Set Bandwidth. A modified version of the Connection Manager Bandwidth tab will allow you to select a different bandwidth limitation. You cannot create a schedule from this dialog box. An existing schedule must already exist in the Connection Manager. |
To help reduce the amount of bandwidth needed to transmit Double-Take Availability data, compression allows you to compress data prior to transmitting it across the network. In a WAN environment this provides optimal use of your network resources. If compression is enabled, the data is compressed before it is transmitted from the source. When the target receives the compressed data, it decompresses it and then writes it to disk. On a default Double-Take Availability installation, compression is disabled.
| Note: |
Any replication sets from a source connected to the same IP address on a target will share the same compression configuration. |
Keep in mind that the process of compressing data impacts processor usage on the source. If you notice an impact on performance while compression is enabled in your environment, either adjust to a lower level of compression, or leave compression disabled. Use the following guidelines to determine whether you should enable compression:
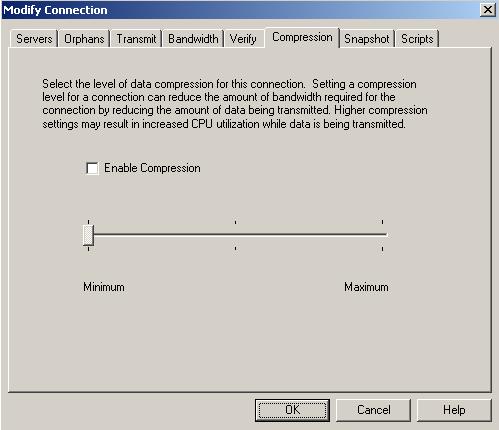
A snapshot is an image of data taken at a single point in time. Snapshots allow you to view files and folders as they existed at points of time in the past, so you can, for example, recover files that were accidentally deleted or overwritten. You could also compare a current revision of a file with an older revision. Double-Take Availability utilizes snapshot functionality by allowing you to create snapshots of the replicated data stored on the Double-Take Availability target.
Double-Take Availability snapshot functionality ensures that you will always have usable data on the target. For example, if your source server becomes infected with a virus, you can revert to a previous snapshot of the data on the target that was created prior to the virus infection. If you know the data on your target is good data, in a usable state, it will minimize application downtime in the event of a source failure. For example, if the source failed and the data on the target is not good due to an incomplete mirror, you can revert to a good snapshot on the target before failover. Snapshots also allow you to retrieve files that a user may have deleted.
Double-Take Availability uses the Microsoft Volume Shadow Copy service to create snapshots. To access this functionality, your target must be running Windows 2003 Service Pack 1 or later. Your servers must also be using the NTFS file system. Snapshots are taken at the volume level, corresponding to the target volumes contained in your replication set. For example, if your replication set contains d:\data and e:\files, the snapshot will contain all of the data on both the d: and e: volumes. If your replication set only includes d:\data (e:\files exists but is not included in the replication set), the snapshot will only contain the d: volume.
Sometimes taking a snapshot may not be possible. For example, there may not be enough disk space to create and store the snapshot, or maybe the target is too low on memory. If a snapshot fails, an Event message and a Double-Take Availability log message are both created and logged.
There are limitations imposed by Microsoft Volume Shadow Copy that impact Double-Take Availability snapshots. For example, Double-Take Availability maintains only 64 snapshots because Volume Shadow Copy only maintains 64 snapshots. If 64 snapshots exist and another one is taken, the oldest snapshots are deleted to make room for the new one. Another example is that Double-Take Availability snapshots must be created within one minute because Volume Shadow Copy snapshots must be created within one minute. If it takes longer than one minute to create the snapshot, the snapshot will be considered a failure. Additionally, Volume Shadow Copy will not revert snapshots of a volume with operating system files, therefore Double-Take Availability is also unable to revert a volume with operating system files. You must also keep in mind that if you are using extended functionality provided by Volume Shadow Copy, you need to be aware of the impacts that functionality may have on Double-Take Availability. For example, if you change the location where the shadow copies are stored and an error occurs, it may appear to be a Double-Take Availability error when it is in fact a Volume Shadow Copy error. Be sure and review any events created by the VolSnap driver and check your Volume Shadow Copy documentation for details.
A snapshot may not necessarily be useful if the data on the target is in a bad state. You only want snapshots of data that is in a good state. Therefore, you need to understand when the data is in a good or bad state.
| Action | State | Description | Automatic Action Taken for Scheduled and Automatic Snapshots | User Interaction Required for Manual Snapshots |
|---|---|---|---|---|
| Mirror Started | Bad | Mirroring has started, but is not complete. The data on the source and target will not be synchronized until the mirror is complete. | Scheduled and automatic snapshots will be delayed until the mirror is complete before taking a snapshot. | Wait until the mirror is complete and the data is in a good state, then take a manual snapshot. |
| Mirror Stopped | Bad | Mirroring has stopped without completing. The data on the source and target will not be synchronized until the mirror is complete. | Scheduled and automatic snapshots will be delayed until the mirror has been restarted and is complete before taking a snapshot. | Restart the mirror, wait until it is complete and the data is in a good state, and then take a manual snapshot. |
| Mirror Complete | Good | Because the mirror is complete, the data on the source and target is synchronized. Double-Take Availability will take a snapshot while the data is in a good state. | Scheduled and automatic snapshots will occur normally. | Manual snapshots can be taken normally. |
| Write Operation Retried | Good | An operation cannot be written to the hard drive on the target. For example, the file could be in use by another application on the target. | Scheduled and automatic snapshots will occur normally, although the operation that is being retried will not be included in the snapshot. | Manual snapshots can be taken normally, although the operation that is being retried will not be included in the snapshot. |
| Write Operation Dropped | Bad | An operation could not be written to the hard drive on the target, even after multiple retries. For example, the file could be in use by another application on the target. |
An automatic snapshot will be taken just prior to the operation being dropped. Scheduled snapshots will be delayed until the target data is back in a good state. |
Start a mirror, wait until it is complete and the data is in a good state, and then take a manual snapshot. |
| Write Operation Succeeded | Good | An operation that was retrying on the target has been successfully written to the hard drive. | Scheduled and automatic snapshots will occur normally. | Manual snapshots can be taken normally. |
| Target Restarted with Connection Persistence | Good | The target service was able to persist connection information prior to restarting. | Scheduled and automatic snapshots will occur normally. | Manual snapshots can be taken normally. |
| Target Restarted without Connection Persistence | Bad | The target service has been restarted and was unable to persist connection information, therefore, operations that were in the queue have been lost. |
An automatic snapshot will be taken after the target restarts, if the target data was in a good state prior to the target restart and the connection is configured to auto-remirror on auto-reconnect. Scheduled snapshots will be delayed until the target data is back in a good state. |
Start a mirror, wait until it is complete and the data is in a good state, and then take a manual snapshot. |
| Restore Required | Good or Bad | The data on the target no longer matches the data on the source because of a failover. This does not necessarily mean that the data on the target is bad. | Scheduled and automatic snapshots will be delayed until a restore is completed or the Restore Required state is overruled by a mirror. Once the restoration or mirror is complete, automatic and scheduled snapshots will occur normally. | Restore the target data back to the source or overrule the Restore Required state by performing a mirror. Once the restoration or mirror is complete, manual snapshots can be taken normally. |
| Snapshot Reverted | Good or Bad | The data on the target no longer matches the data on the source because a snapshot has been applied on the target. This does not necessarily mean that the data on the target is bad. | Scheduled and automatic snapshots will be delayed until a restore is completed or the Snapshot Reverted state is overruled by a mirror. Once the restoration or mirror is complete, automatic and scheduled snapshots will occur normally. | Restore the target data back to the source or overrule the Snapshot Reverted state by performing a mirror. Once the restoration or mirror is complete, manual snapshots can be taken normally. |
| Restore Complete | Good | Because the restoration is complete, the data on the source and target is synchronized. | Scheduled and automatic snapshots will occur normally. | Manual snapshots can be taken normally. |
To be completely assured that your data on the target is good, automatic and scheduled snapshots only occur when the data is in a good Double-Take Availability state. However, manual snapshots can be taken during any state. There are instances when you may want to take a manual snapshot, even if the target data is in a bad state. For example, if you drop an operation, that does not necessarily mean your data on the target is corrupt or the target would be unable to stand in for the source in the event of a failure. A snapshot of a bad state may be useful and usable, depending on your environment. If your source is a file server and an operation has been dropped, it is just one user file that is out-of-date. All of the remaining target files are intact and can be accessed in the event of a failure.
However, if your source is an application server and an operation has been dropped, that one file could cause the application not to start on the target in the event of a failure. In these cases, manual snapshots of a bad state depend on the context of your environment.
| Note: | Because the driver for Volume Shadow Copy is started before the driver for Double-Take Availability, if you revert any files on the source that are contained in your replication set, Double-Take Availability will not be aware of the revert and, therefore, the file change will not be replicated to the target. The file change will be mirrored to the target during the next mirroring process. |
When Double-Take Availability transitions from a good state to a bad state, it will automatically attempt to take a snapshot of the data before it leaves the good state and enters the bad state. For example, if your data is in a good state and you start a mirror, before the mirror is started, Double-Take Availability will automatically take a snapshot of the target. In the event the mirror fails to complete, you will have a snapshot of the data on the target when it was in its last good state.
Only one automatic snapshot per connection is maintained on the target. When an automatic snapshot is taken, it replaces any previous automatic snapshots.
You can schedule snapshots of your target data to fit your environment and needs. If the target data is in a bad state at the time of a scheduled snapshot, the snapshot will be delayed until the data on the target reaches a good state. If multiple scheduled snapshots are delayed, only one snapshot will be taken when the data reaches a good state.
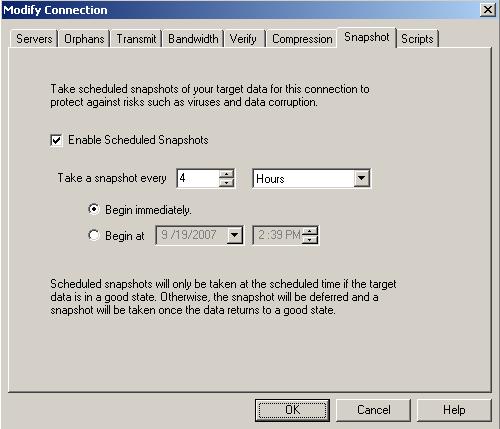
You can manually take a snapshot of the data on the target at any time. If an automatic or scheduled snapshot is currently in progress, Double-Take Availability will wait until that one is finished before taking the manual snapshot. Open the Replication Console, right-click the connection, and select Snapshot Now.
By default, snapshots are enabled for full-server and application protections. Also by default, a snapshot is taken every 60 minutes. This may lead to numerous snapshots on the target that you may want to manage. You can do that from the Full-Server Failover Manger by selecting Actions, Snapshot Manager or from the Application Manager by selecting Tools, Manage Snapshots. (These options are only available when a source and target are selected and protection is enabled.)
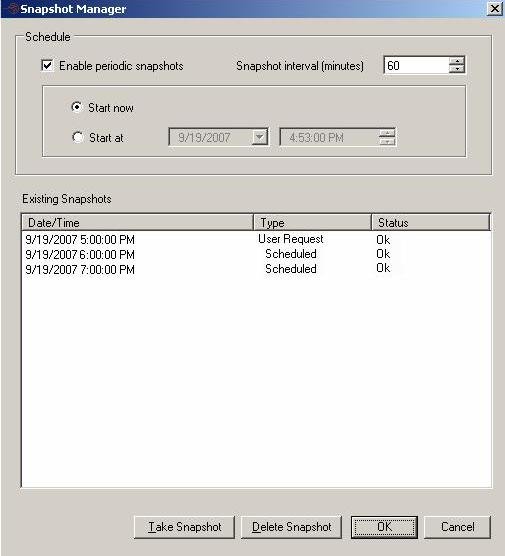
Use the following options to manage your full-server and application workload snapshots. (The dialog box will appear different between the Full-Server Failover Manager and the Application Manager, but the options are the same.)
| Type | Description |
|---|---|
| Scheduled | This snapshot was taken as part of a periodic snapshot. |
| Deferred | This snapshot was taken as part of a periodic snapshot, although it did not occur at the specified interval because the connection between the source and target was not in a good state. |
| User Request | This snapshot was taken manually by a user. |
| Note: |
The Schedule options at the top of the are the same options from when you configured protection. If you change the options in one location, they will be changed in the other location too. The Existing Snapshots list only contains snapshots from full-server and application protection workloads. Snapshots from other utilities and tools will not be listed. |
To ensure protection of your data, Double-Take Software products offer multi-level security using native operating system security features. Privileges are granted through membership in user groups defined on each machine. To gain access to a source or target, the user must provide a valid operating system user name and password and the specified user name must be a member of one of the Double-Take Availability security groups. Once a valid user name and password have been provided and the source or target has verified membership in one of the security groups, the user is granted appropriate access to the source or target and the corresponding features are enabled in the client. Access is granted on one of the following three levels.
Although passwords are encrypted when they are stored, Double-Take Software security design does assume that any machine running the client application is protected from unauthorized access. If you are running the client and step away from your machine, you must protect your machine from unauthorized access.
When a client machine attempts to access a source or target machine running on Windows, it will attempt to automatically logon to the source or target using the three methods below.
| Note: |
You can disable the feature that maintains the security credentials in the registry. |
| Note: |
The credentials buffer is cleared each time the client application is closed. |
The client tries each of these three methods until a set of credentials granting Administrator access is found. If no credentials granting Administrator access are found, the client attempts to find a set of credentials granting Monitor access. If no credentials grant Monitor access, the user must manually logon to the source or target by providing a user name, password, and domain.
| Note: | If a user name exists both on the local machine and on the network, Windows first attempts to login to the machine with the local user name and password and ignores the domain. If this fails, it then tries to login with the network user name, password and domain. |
The security groups are automatically created during the installation process. The groups are assigned specific case-sensitive names.
The local administrator and the domain administrator are automatically added to the Double-Take Admin group.
| Note: | If Double-Take Availability is installed on a member servers, it will use the local groups. If an Active Directory user is granted access to the Active Directory Double-Take Admin or Double-Take Monitors groups, the user or domain group must also be granted access to the local Double-Take Availability groups. If Double-Take Availability is installed on a domain controller, the Active Directory group will provide sufficient access. The groups are created in the Users OU and need to stay here. If the groups are not there, users will be unable to log into Double-Take Availability on the domain controller. |
Users that need administrator access to Double-Take Availability must be added to the Double-Take Admin group. All users that need monitor only access must be added to the Double-Take Monitors group. In both cases, local users, domain users, or global groups may be added to the local groups.
To add, delete, or modify users for a group, follow these steps.
By default, the Double-Take service is configured to log on as the system account. If you want to select a specific account to run the service, use these instructions.
| Note: | If you are protecting full-server workloads, you cannot modify the account used to run the Double-Take service. Otherwise, the full-server protection will not function correctly. |
| Note: |
If domain-level policy settings are defined (through Domain Security Policy, Security Settings, Local Policies, User Rights Assignment), they will override local policy settings. |
If you want to use Active Directory registration, the Double-Take service must have privileges to modify Active Directory. There are two options for assigning the privileges.
| Note: |
If your corporate policies require that only the minimum required privileges be supplied, you can select only the permissions listed below by modifying the Advanced permissions for the account.
|
You may want to evaluate Double-Take Availability before implementing it in your production environment. This is a good process for users who want to see, first-hand, the benefits that Double-Take Availabilityhas to offer.
The evaluation processes walk you through a step-by-step process to assess the key Double-Take Availability features. Select a link below based on the type of evaluation you would like to perform.
For the evaluation, you should install in a test environment. Do no use actual production servers because you will be forcing a failure during the evaluation.
The following evaluation procedure has eleven tasks containing step-by-step instructions for evaluating the data protection functionality of Double-Take Availability.
Before starting this evaluation procedure, make sure you have reviewed the server requirements and that you have installed the software on both the source and target.
Also, you should have approximately 500 MB to 1 GB of data on the source for testing. If you are going to be protecting application data, make sure the application is pre-installed on the target, but the application is not running on the target. If the application is running on the target, the files will be held open and Double-Take Availability will not be able to write to the files. In the event of a source failure, the application can be started on the target and the files can then be accessed.
| Note: | For the evaluation, you should install in a test environment. Do no use actual production servers because you will be forcing a failure during the evaluation. |
This evaluation consists of the following tasks.
| Note: |
If the Double-Take Servers root is highlighted in the left pane of the Replication Console, the Connection Wizard menu option will not be available. To access the menu, expand the server tree in the left pane, and highlight a server in the tree. |
| Note: |
At any time while using the Connection Wizard, click Back to return to previous screens and review your selections. |
| Note: |
Double-Take Availability will automatically attempt to log on to the selected source using the identification of the user logged on to the local machine. If the logon is not successful, the Logon dialog box will appear prompting for your security identification. When logging in, the user name, password, and domain are limited to 100 characters. |
| Note: |
Double-Take Availability will automatically attempt to log on to the selected target using the identification of the user logged on to the local machine. If the logon is not successful, the Logon dialog box will appear prompting for your security identification. When logging in, the user name, password, and domain are limited to 100 characters. |
View your new connection in the Replication Console by highlighting the source on the left pane. The connection will appear on the right pane. Use the horizontal scroll bar at the bottom of the right pane to view the various status columns. Pay attention to the Mirror Status column which shows the status of the mirroring operation. During the mirroring process, you will see a percentage of the mirror that has been completed. When the Mirror Status changes to Idle, there is no mirroring activity, meaning your initial mirror has completed.
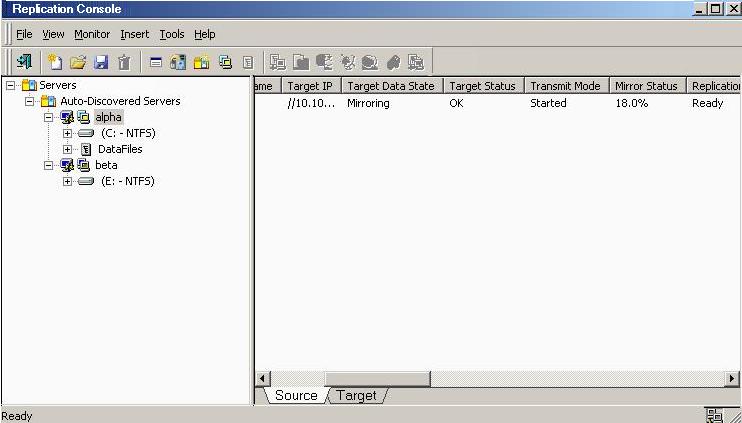
To view specific mirroring statistics that may be of interest, use the horizontal scroll bar at the bottom of the right pane of the Replication Console window to view the various columns.
Monitoring a data workload contains complete details on all of the Replication Console statistics.
After your mirror is complete, look at your target and you will see the replicated data stored in the location you specified. Now you are ready to continue with the evaluation.
In order to test replication, you need to change the data on your source. This includes modifying existing files, creating new files, deleting files, and changing permissions and attributes.
Monitoring a data workload contains complete details on all of the Replication Console statistics.
| Note: |
Many user applications typically save an entire file even though only a portion of the file may have changed. Therefore, the replication statistics will show the entire file being transmitted, not just the changed data. To confirm that replication only transmits the changed segments of files, you must use an application, such as a database application, or a command, such as the echo command, to save only the changed portions of a file. |
You may notice your Replication Status toggle between Replicating and Ready as it continues processing the file changes, when your Replication Status stays at Ready, Double-Take Availability is waiting for additional changes to transmit. After replication is complete, you are ready to continue with the evaluation.
Now that you have modified some of the files, you want to be sure that the file modifications were applied correctly.
| Note: |
Because of the way the Windows Cache Manager handles memory, machines that are doing minimal or light processing, as you are in this evaluation, may have file operations that remain in the cache until additional operations flush them out. This may make Double-Take Availability files on the target appear as if they are not synchronized. When the Windows Cache Manager releases the operations in the cache on the source, the files will be updated on the target. To make sure this does not impact your testing, flush the cache by copying a couple of files from one directory to another and then deleting them. |
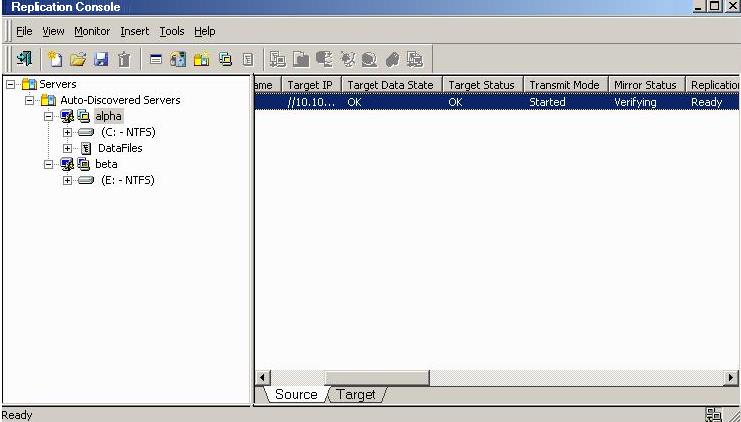
Just like when you were monitoring the mirror and replication processes, you can monitor the verification process. Notice that the Mirror Status column changes to Verifying while the verification process occurs. When the verification is complete, Double-Take Availability will have created a log file for you to review.
| Note: |
Since your target file is newer, make sure that Only if Source file is newer than Target copy is not selected. |
At this point in your evaluation, you may want to test your target data. The type of testing you will need to perform will depend on the type of data you are protecting.
When the mirror is complete, your source and target will again be synchronized and you can continue with your evaluation.
The following instructions will configure failover monitoring.
At this point, in terms of your evaluation, your failover configuration is complete because you will be using the default settings for the remaining options. But while you are viewing the Monitor Settings dialog box, notice the flexible configuration options available to you.
Since it can be essential to quickly know the status of failover, Double-Take Availability offers various methods for monitoring the state of failover. When the Failover Control Center is running, you will see four visual indicators.
| Note: |
You can minimize the Failover Control Center and, although it will not appear in your Windows taskbar, it will still be active and the failover icon will still appear in the desktop icon tray. The Failover Control Center does not have to be running for failover to occur. |
Monitoring failover monitoring contains more information on the Failover Control Center visual indicators.
To fully evaluate failover, you need to simulate a failure. The Failover Control Center does not have to be running in order for failover to occur, but for the purpose of this evaluation, make sure that it is running so that you can see each step of the process.
| Note: |
The Event log on the target provides details on the actual steps that have occurred during failover. |
As you can see, the target has taken on the identity of the source. Application and user requests destined for the source are routed directly to the target. The impact on your end users is minimal.
While your source is failed over to your target, end users continue to work without interruption and the data on the target will be updated. To fully evaluate the next step, restoration, simulate the changes that the end users would have made on the target while the source was unavailable.
If desired, you can also test the target data as you did earlier. You can test user data using the associated application, and you can save the changes if desired. If you want to test application data, start the application services on the target, and test the application data by using clients to connect to the application. Because the source is now failed over, you will not need to worry about pausing the target or configuring clients to access the application from the target. The clients will continue to access the source, which is now being handled by the target machine.
When failover occurs, a source machine has failed. The steps below must be used to complete failback, which releases the source identity from the target.
| Warning: | Do not connect the source machine to the network at this time. |
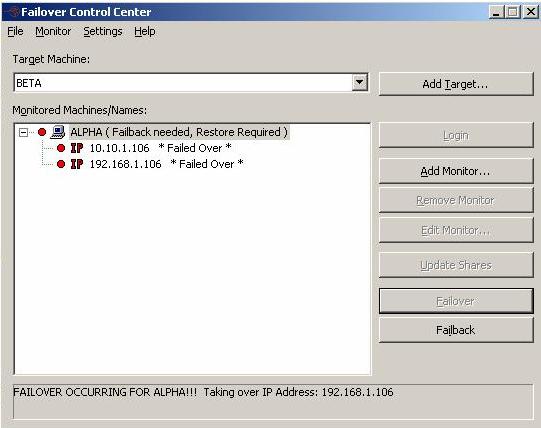
At this time, your target is back to its original identity and the source is back online.
The Replication Console provides an easy method for restoring replicated data from the target back to the original source or to a new source server. You are only required to input the original source, the target, and the name of the replication set you want to restore. Double-Take Availability handles the rest, including selecting the files in the replication set and restoring them to the correct location.
Once the restoration is complete, your evaluation is complete. Congratulations!
The following evaluation procedure has five tasks containing step-by-step instructions for evaluating the full-server protection functionality of Double-Take Availability.
Before starting this evaluation procedure, make sure you have reviewed the server requirements and that you have installed the software on both the source and target. Also, make sure that the target you select is compatible to stand-in as the source.
| Note: | For the evaluation, you should install in a test environment. Do no use actual production servers because you will be forcing a failure during the evaluation. |
This evaluation consists of the following tasks.
After you have enabled full-server protection, you can monitor the protection from the Full-Server Failover Manager. The Protection Status is displayed in the right center of the Full-Server Failover Manager. You can tell the status of your protection from this field.
Once protection is Enabled, if the source should fail, the target can stand-in for the source.
In order to test replication, you need to change the data on your source. This includes modifying existing files, creating new files, deleting files, and changing permissions and attributes.
| Note: |
Because of the way the Windows Cache Manager handles memory, machines that are doing minimal or light processing, as you are in this evaluation, may have file operations that remain in the cache until additional operations flush them out. This may make Double-Take Availability files on the target appear as if they are not synchronized. When the Windows Cache Manager releases the operations in the cache on the source, the files will be updated on the target. To make sure this does not impact your testing, flush the cache by copying a couple of files from one directory to another and then deleting them. |
To fully evaluate failover, you need to simulate a failure. To do this, power off the source. Watch as the status changes to Failover condition met.
When a failover condition is met, you will want to start failover. You can actually start failover without a failover condition, as long as protection is enabled. For example, you may want to force a failover when upgrading to a better source server.
| Note: | If you are testing failover and your source is a domain controller, do not let the domain controller communicate with any other production domain controllers after failover. Otherwise, when the original source domain controller is brought online after the test, it may create a USN rollback scenario if the test domain controller was allowed to communicate with other production domain controllers. |
| Note: | Because the Windows product activation is dependent on hardware, you may need to reactivate your Windows registration after failover. Follow the on-screen prompts to complete the reactivation. |
After your target has failed over and becomes your source, you can stay with that configuration long term. However, in some instances, it may be necessary or desired to go back to using the original hardware after you have failed over.
 The console is attempting to communicate with the server.
 The server is online and the console is communicating with it.
  The server is offline, so the console cannot communicate with it.
  The console has lost communication with the server.
  Administrator access
 Monitor only access
 No security access
 The connection is in a healthy state.
  The connection is in an unknown state.